Before going into what tools and data are available, I feel a quick introduction to geospatial data is in order. I’m going to gloss over some things and greatly oversimplify others. If you want to know more, I would suggest checking out books such as Map Projections: A Working Manual by Snyder or some excellent tutorials on map projections and GIS that can be found via your favorite web search engine.
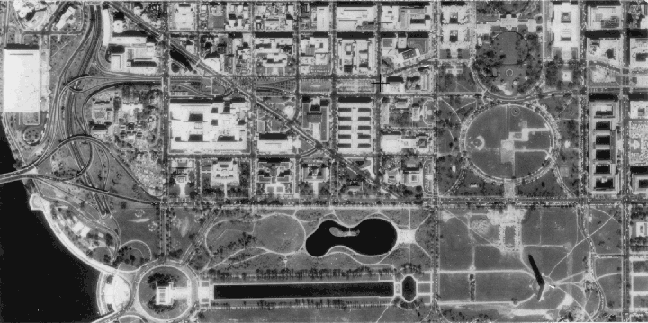
To begin, there are two main types of geospatial data available: raster and vector. Raster data are usually things such as aerial or satellite photographs, scanned paper maps, and so on. Vector data are mathematical vectors that describe items such as lines for roads, polygons for areas like parks, and others. As is, aerial photographs or vectors do not fully describe the Earth’s surface. They do not represent a one to one correlation between a point on the map and a location on the ground. They have to be run through a process called georectification to mathematically translate them to a coordinate system known as a map projection.
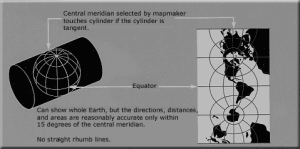
Map projections are mathematical descriptions of the surface of the Earth. As most of you (hopefully) know, the Earth is not flat. It’s a large spherical object with dents (canyons) and bumps (mountains). Since it’s not a flat sphere, it’s impossible to model it with 100 percent accuracy. Map projections were created that describe the Earth in terms of a series of equations that define a spheroid with various characteristics. These characteristics are useful for different types of representations, from maps of continents to maps of cities. I suggest you look at websites such as Map Projections: From Spherical Earth to Flat Map to get a more in-depth discussion. Basically, think of a map projection as establishing an average elevation of the Earth’s surface with areas where it’s more accurate than others.
Georectification then takes the flat two-dimensional image or vector data and warps it so that it fits the three-dimensional surface of the Earth as approximated by the map projection. Once transformed, each pixel in a map image or each point on a vector matches its corresponding point on the Earth’s surface. Inside a GIS, you can then move the cursor around and see the matching latitude and longitude on the ground. If you wanted, you could take a GPS and even go there.
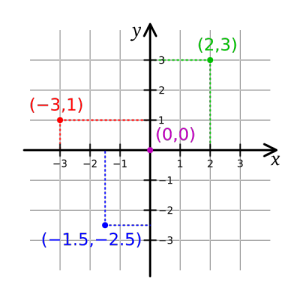
GIS file formats then allow the mathematical parameters that went into georectification to be encoded into the file as well. These are usually a large amount of numbers that describe the equations used and the inputs into all of those equations. Many times you’ll see something like below if you use a tool such as listgeo that can parse the information out of the file format. Note that most formats assume a Cartesian coordinate system running from coordinates (0,0) in the upper left corner to some X and Y to the size of the data set.
listgeo o39102g6.tif
Geotiff_Information:
Version: 1
Key_Revision: 0.2
Tagged_Information:
ModelTiepointTag (2,3):
0 0 0
691331.977 4417194.85 0
ModelPixelScaleTag (1,3):
2.4384 2.4384 0
End_Of_Tags.
Keyed_Information:
GTModelTypeGeoKey (Short,1): ModelTypeProjected
GTRasterTypeGeoKey (Short,1): RasterPixelIsArea
ProjectedCSTypeGeoKey (Short,1): PCS_NAD27_UTM_zone_13N
PCSCitationGeoKey (Ascii,25): "UTM Zone 13 N with NAD27"
End_Of_Keys.
End_Of_Geotiff.

PCS = 26713 (NAD27 / UTM zone 13N)
Projection = 16013 (UTM zone 13N)
Projection Method: CT_TransverseMercator
ProjNatOriginLatGeoKey: 0.000000 ( 0d 0' 0.00"N)
ProjNatOriginLongGeoKey: -105.000000 (105d 0' 0.00"W)
ProjScaleAtNatOriginGeoKey: 0.999600
ProjFalseEastingGeoKey: 500000.000000 m
ProjFalseNorthingGeoKey: 0.000000 m
GCS: 4267/NAD27
Datum: 6267/North American Datum 1927
Ellipsoid: 7008/Clarke 1866 (6378206.40,6356583.80)
Prime Meridian: 8901/Greenwich (0.000000/ 0d 0' 0.00"E)
Projection Linear Units: 9001/metre (1.000000m)

Corner Coordinates:
Upper Left ( 691331.977, 4417194.851) (102d45'44.74"W, 39d53' 6.48"N)
Lower Left ( 691331.977, 4400540.579) (102d46' 2.23"W, 39d44' 6.68"N)
Upper Right ( 704806.576, 4417194.851) (102d36'17.89"W, 39d52'55.15"N)
Lower Right ( 704806.576, 4400540.579) (102d36'36.61"W, 39d43'55.41"N)
Center ( 698069.276, 4408867.715) (102d41'10.37"W, 39d48'31.03"N)
Output of the listgeo command.
From the above output, we can see a few things that describe this image. It came from a USGS DRG that was mathematically warped to a projection (which is why some of them look “tilted” if you’ve looked at a lot of DRGs). Under the ModelTiepointTag key we see several zeros then the numbers 691331.977 and 4417194.85. If you look at the DRG as a two dimensional grid, those numbers represent the latitude and longitude (x, y) coordinates of the upper left pixel in the image. The projection of the DRGs uses meters so the x and y here represent meters in the coordinate system. Under the ModelPixelScaleTag we see another set of numbers, including 2.4384 listed twice. This is the per-pixel scale of the image in meters. So this means that as you increase in the x- or y- direction of the image, each pixel you count up equals 2.4384 meters on the ground. Moving from pixel (0,0) to (10,10) in this case only moves you by a value of 10 on the grid, but would move you 24.384 meters on the ground.
Scale is another issue that may seem counter-intuitive to many people. There are two scales of data that you may hear about: large and small scale. Large scale actually means data that is more detailed than a small scale. The scales do not reference the size of the map but the scale of the map to the Earth. Obviously a 1:1 scale map of the Earth is not feasible since it would have to be as large as the planet. Maps are scaled down to make them much smaller. A common size of a large scale map is 1:25,000 and a small scale map is 1:100,000. The 1:25,000 map is called a large scale because it’s fractional size is larger than that of the 1:100,000 scale map (think of the scales as fractions). A 1:25,000 large scale map does not show as much surface area as the 1:100,000 small scale map, but it shows an area in much more detail than the small scale map does. Think of a large scale map as maps of things like cities, while small scale maps are more along the lines of maps of entire countries.
With the scale discussion out-of-the-way, we then must turn to the usability of geospatial data. Much digital map data was collected from paper maps. Thus, the digital data has a scale where it is most accurate and less accurate at others. Data collected at 1:25,000 scale will be more accurate than data collected at 1:100,000. A GIS allows you to zoom in to the data and in some cases over-zoom past the actual accuracy of the data. Consider data such as a USGS Digital Elevation Model that was collected on a ten meter grid. You can zoom to a view where each pixel on the screen is smaller than ten meters on the ground, but your measurements will not be any more accurate than the ten meter grid you are viewing. Another example is looking at two road maps where one was collected at 1:25,000 and the other at 1:250,000. If you overlay the road maps on to a georeferenced aerial photograph, the 1:25,000 lines will more closely follow actual roads than the ones from the 1:250,000. You cannot expect the 1:250,000 data to be as accurate as the larger scale data, so zooming into a data set will not make the 1:250,000 data any more accurate than the scale where it was captured.
With this out-of-the-way, next time we will start looking at Open Source tools to use the data.


