Using Free Geospatial Tools and Data Part 8.2: US Census TIGER Data National Files

In Part 8.1, we went over how the Census ftp site was set up and what kind of data each directory has in it. We also loaded our first Census data, which were outlines of the US states and territories. In this installment, we will load all the national files on the Census FTP site. These are all individual files so will be easier to load. Next time we will look at using scripts to convert the rest of the county-based data into state-based datasets.

We are not going to download everything on the Census website. Some of the data you will likely never need. However, once these articles are done you should be able to download and create tables from the other data directories should you decide you need them. After each load, I will show a screen shot of how the data table looks inside QGIS so you can make sure everything loaded properly.

This is a rather lengthy post as it shows the commands you should type as well as the output so you can check that what you are doing works correctly. Be glad I do not sell advertising or this would be spread across many pages 😉

For this set aside some time as the Census ftp site limits connection speeds to keep people from using up all of their bandwidth. Open a shell prompt, change to a directory where you will download the data, and run the command:

lftp ftp://ftp2.census.gov/geo/tiger/TIGER2013

Type the command cls and you will see this listing:

lftp ftp2.census.gov:/geo/tiger/TIGER2013> cls
2013-FolderNames-Defined.pdf AREAWATER/ COUSUB/ FACESMIL/ PLACE/ SLDL/ UAC/
ADDR/ BG/ CSA/ FEATNAMES/ POINTLM/ SLDU/ UNSD/
ADDRFEAT/ CBSA/ EDGES/ LINEARWATER/ PRIMARYROADS/ STATE/ ZCTA5/
ADDRFN/ CD/ ELSD/ METDIV/ PRISECROADS/ SUBMCD/
AIANNH/ CNECTA/ ESTATE/ MIL/ PUMA/ TABBLOCK/
AITS/ COAST/ FACES/ NECTA/ RAILS/ TBG/
ANRC/ CONCITY/ FACESAH/ NECTADIV/ ROADS/ TRACT/
AREALM/ COUNTY/ FACESAL/ OTHERID/ SCSD/ TTRACT/
lftp ftp2.census.gov:/geo/tiger/TIGER2013>

Here we will download the datasets that come in single national-level files from the Census. Run the following commands inside lftp, waiting for each to finish:

lftp ftp2.census.gov:/geo/tiger/TIGER2013> mirror COUNTY/
lftp ftp2.census.gov:/geo/tiger/TIGER2013> mirror AIANNH/
lftp ftp2.census.gov:/geo/tiger/TIGER2013> mirror AITS/
lftp ftp2.census.gov:/geo/tiger/TIGER2013> mirror ANRC/
lftp ftp2.census.gov:/geo/tiger/TIGER2013> mirror CBSA/
lftp ftp2.census.gov:/geo/tiger/TIGER2013> mirror CD/
lftp ftp2.census.gov:/geo/tiger/TIGER2013> mirror CNECTA/
lftp ftp2.census.gov:/geo/tiger/TIGER2013> mirror COAST/
lftp ftp2.census.gov:/geo/tiger/TIGER2013> mirror ESTATE/
lftp ftp2.census.gov:/geo/tiger/TIGER2013> mirror METDIV/
lftp ftp2.census.gov:/geo/tiger/TIGER2013> mirror MIL/
lftp ftp2.census.gov:/geo/tiger/TIGER2013> mirror NECTA/
lftp ftp2.census.gov:/geo/tiger/TIGER2013> mirror NECTADIV/
lftp ftp2.census.gov:/geo/tiger/TIGER2013> mirror PRIMARYROADS/
lftp ftp2.census.gov:/geo/tiger/TIGER2013> mirror RAILS/
lftp ftp2.census.gov:/geo/tiger/TIGER2013> mirror TBG/
lftp ftp2.census.gov:/geo/tiger/TIGER2013> mirror UAC/
lftp ftp2.census.gov:/geo/tiger/TIGER2013> mirror ZCTA5/

This gives you a good number of files to add to your database for this part of the series. Type quit or hit Control-D to exit lftp.

We will start with the files under COUNTY as this will give you the county outlines to match the state outlines you loaded during the last installment. Change directory (cd) into the COUNTY directory and unzip the tl_2013_us_county.zip file:

[bmaddox@girls COUNTY]$ unzip tl_2013_us_county.zip 
Archive: tl_2013_us_county.zip
inflating: tl_2013_us_county.dbf 
inflating: tl_2013_us_county.prj 
inflating: tl_2013_us_county.shp 
inflating: tl_2013_us_county.shp.xml 
inflating: tl_2013_us_county.shx 
[bmaddox@girls COUNTY]$ ls -l
total 188336
-rwxrwxr-x 1 bmaddox bmaddox 948140 Aug 6 2013 tl_2013_us_county.dbf
-rwxrwxr-x 1 bmaddox bmaddox 165 Aug 6 2013 tl_2013_us_county.prj
-rwxrwxr-x 1 bmaddox bmaddox 118339660 Aug 6 2013 
tl_2013_us_county.shp
-rwxrwxr-x 1 bmaddox bmaddox 24960 Aug 6 2013 
tl_2013_us_county.shp.xml
-rwxrwxr-x 1 bmaddox bmaddox 25972 Aug 6 2013 tl_2013_us_county.shx
-rwxrw-r-x 1 bmaddox bmaddox 73500446 Aug 16 2013 
tl_2013_us_county.zip
[bmaddox@girls COUNTY]$

Now run the command:

shp2pgsql -s 4269 -c -D -I -W LATIN1 tl_2013_us_county.shp county_outlines |psql -d Census_2013

Your command will look similar to the following output. Here I am running the import commands on the same server that is hosting the database.

[bmaddox@girls COUNTY]$ shp2pgsql -s 4269 -c -D -I -W LATIN1 tl_2013_us_county.shp county_outlines |psql -d Census_2013 
Shapefile type: Polygon
Postgis type: MULTIPOLYGON[2]
SET
SET
BEGIN
NOTICE: CREATE TABLE will create implicit sequence 
"county_outlines_gid_seq" for serial column "county_outlines.gid"
CREATE TABLE
NOTICE: ALTER TABLE / ADD PRIMARY KEY will create implicit index 
"county_outlines_pkey" for table "county_outlines"
ALTER TABLE
addgeometrycolumn 
-----------------------------------------------------------------
public.county_outlines.geom SRID:4269 TYPE:MULTIPOLYGON DIMS:2 
(1 row) 
CREATE INDEX
COMMIT
[bmaddox@girls COUNTY]$

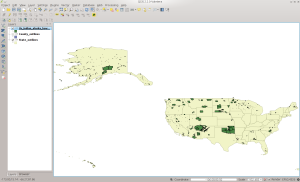
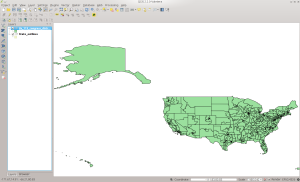
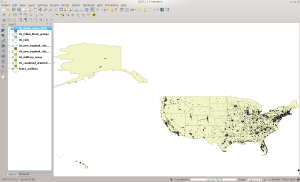
Run QGIS and load the state table that you created in the last installment. Once that finishes, add the county_outlines layer. Once loaded, it should look like this screen shot:

US County Outlines in QGIS

US County Outlines in QGIS

Now change to the AIANNH directory. This is the American Indian / Alaska Native / Native Hawaiian Areas dataset. This data contains information such as land and water area in each regional corporation. Run the following commands to unzip and load the data into PostGIS, substituting values specific to your setup:

[bmaddox@girls AIANNH]$ unzip tl_2013_us_aiannh.zip 
Archive: tl_2013_us_aiannh.zip
inflating: tl_2013_us_aiannh.dbf 
inflating: tl_2013_us_aiannh.prj 
inflating: tl_2013_us_aiannh.shp 
inflating: tl_2013_us_aiannh.shp.xml 
inflating: tl_2013_us_aiannh.shx 
[bmaddox@girls AIANNH]$ ls -l
total 21576
-rwxrwxr-x 1 bmaddox bmaddox 232620 Aug 6 2013 tl_2013_us_aiannh.dbf
-rwxrwxr-x 1 bmaddox bmaddox 165 Aug 6 2013 tl_2013_us_aiannh.prj
-rwxrwxr-x 1 bmaddox bmaddox 13362524 Aug 6 2013 tl_2013_us_aiannh.shp
-rwxrwxr-x 1 bmaddox bmaddox 31978 Aug 6 2013 
tl_2013_us_aiannh.shp.xml
-rwxrwxr-x 1 bmaddox bmaddox 6708 Aug 6 2013 tl_2013_us_aiannh.shx
-rwxrw-r-x 1 bmaddox bmaddox 8447076 Aug 16 2013 tl_2013_us_aiannh.zip
[bmaddox@girls AIANNH]$ shp2pgsql -s 4269 -c -D -I 
tl_2013_us_aiannh.shp US_Indian_Alaska_Hawaii_Native_Areas |psql -d 
Census_2013 
Shapefile type: Polygon
Postgis type: MULTIPOLYGON[2]
SET
SET
BEGIN
NOTICE: CREATE TABLE will create implicit sequence 
"us_indian_alaska_hawaii_native_areas_gid_seq" for serial column 
"us_indian_alaska_hawaii_native_areas.gid"
CREATE TABLE
NOTICE: ALTER TABLE / ADD PRIMARY KEY will create implicit index 
"us_indian_alaska_hawaii_native_areas_pkey" for table 
"us_indian_alaska_hawaii_native_areas"
ALTER TABLE
addgeometrycolumn 
----------------------------------------------------------------------
----------------
public.us_indian_alaska_hawaii_native_areas.geom SRID:4269 
TYPE:MULTIPOLYGON DIMS:2 
(1 row)
CREATE INDEX
COMMIT
[bmaddox@girls AIANNH]$

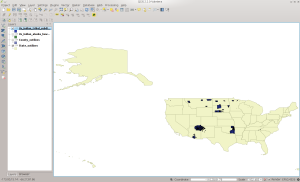
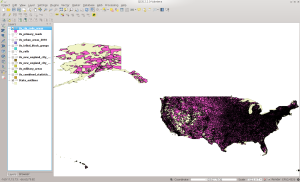
The loaded data should look similar to the screen shot below:

AIANNH Dataset

AIANNH Dataset

Next change to the AITS directory. This is the American Indian Tribal Subdivision dataset. It contains information similar to the AIANNH dataset. Since the technique should be familiar now, here are the commands to run and their output. Again, substitute the specific values applicable to your setup.

[bmaddox@girls census]$ cd AITS/
[bmaddox@girls AITS]$ ls
tl_2013_us_aitsn.zip
[bmaddox@girls AITS]$ unzip tl_2013_us_aitsn.zip 
Archive: tl_2013_us_aitsn.zip
inflating: tl_2013_us_aitsn.dbf 
inflating: tl_2013_us_aitsn.prj 
inflating: tl_2013_us_aitsn.shp 
inflating: tl_2013_us_aitsn.shp.xml 
inflating: tl_2013_us_aitsn.shx 
[bmaddox@girls AITS]$ ls -l
total 14900
-rwxrwxr-x 1 bmaddox bmaddox 134814 Aug 6 2013 tl_2013_us_aitsn.dbf
-rwxrwxr-x 1 bmaddox bmaddox 165 Aug 6 2013 tl_2013_us_aitsn.prj
-rwxrwxr-x 1 bmaddox bmaddox 9291396 Aug 6 2013 tl_2013_us_aitsn.shp
-rwxrwxr-x 1 bmaddox bmaddox 21736 Aug 6 2013 tl_2013_us_aitsn.shp.xml
-rwxrwxr-x 1 bmaddox bmaddox 3884 Aug 6 2013 tl_2013_us_aitsn.shx
-rwxrw-r-x 1 bmaddox bmaddox 5794063 Aug 16 2013 tl_2013_us_aitsn.zip
[bmaddox@girls AITS]$ shp2pgsql -s 4269 -c -D -I -WLATIN1 tl_2013_us_aitsn.shp US_Indian_Tribal_Subdivisions |psql -d Census_2013 
Shapefile type: Polygon
Postgis type: MULTIPOLYGON[2]
SET
SET
BEGIN
NOTICE: CREATE TABLE will create implicit sequence "us_indian_tribal_subdivisions_gid_seq" for serial column "us_indian_tribal_subdivisions.gid"
CREATE TABLE
NOTICE: ALTER TABLE / ADD PRIMARY KEY will create implicit index "us_indian_tribal_subdivisions_pkey" for table "us_indian_tribal_subdivisions"
ALTER TABLE
addgeometrycolumn 
-------------------------------------------------------------------------------
public.us_indian_tribal_subdivisions.geom SRID:4269 TYPE:MULTIPOLYGON DIMS:2 
(1 row)
CREATE INDEX
COMMIT
[bmaddox@girls AITS]$

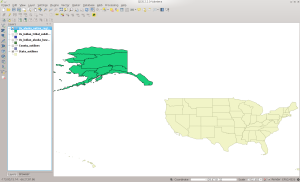
The dataset should look like the following screen shot in QGIS:

AITS Dataset

AITS Dataset

Next up is the Alaska Native Regional Corporations dataset. As with the other datasets, here are the commands you will use to load the data into PostGIS:

[bmaddox@girls census]$ cd ANRC
[bmaddox@girls ANRC]$ ls -l
total 752
-rwxrw-r-x 1 bmaddox bmaddox 768407 Aug 16 2013 tl_2013_02_anrc.zip
[bmaddox@girls ANRC]$ unzip tl_2013_02_anrc.zip 
Archive: tl_2013_02_anrc.zip
inflating: tl_2013_02_anrc.dbf 
inflating: tl_2013_02_anrc.prj 
inflating: tl_2013_02_anrc.shp 
inflating: tl_2013_02_anrc.shp.xml 
inflating: tl_2013_02_anrc.shx 
[bmaddox@girls ANRC]$ ls -l
total 1896
-rwxrwxr-x 1 bmaddox bmaddox 3890 Aug 6 2013 tl_2013_02_anrc.dbf
-rwxrwxr-x 1 bmaddox bmaddox 165 Aug 6 2013 tl_2013_02_anrc.prj
-rwxrwxr-x 1 bmaddox bmaddox 1131900 Aug 6 2013 tl_2013_02_anrc.shp
-rwxrwxr-x 1 bmaddox bmaddox 21487 Aug 6 2013 tl_2013_02_anrc.shp.xml
-rwxrwxr-x 1 bmaddox bmaddox 196 Aug 6 2013 tl_2013_02_anrc.shx
-rwxrw-r-x 1 bmaddox bmaddox 768407 Aug 16 2013 tl_2013_02_anrc.zip
[bmaddox@girls ANRC]$ shp2pgsql -s 4269 -c -D -I tl_2013_02_anrc.shp US_Alaska_Native_Regional_Corporations |psql -d Census_2013 
Shapefile type: Polygon
Postgis type: MULTIPOLYGON[2]
SET
SET
BEGIN
NOTICE: CREATE TABLE will create implicit sequence "us_alaska_native_regional_corporations_gid_seq" for serial column "us_alaska_native_regional_corporations.gid"
CREATE TABLE
NOTICE: ALTER TABLE / ADD PRIMARY KEY will create implicit index "us_alaska_native_regional_corporations_pkey" for table "us_alaska_native_regional_corporations"
ALTER TABLE
addgeometrycolumn ----------------------------------------------------------------------------------------
public.us_alaska_native_regional_corporations.geom SRID:4269 TYPE:MULTIPOLYGON DIMS:2 
(1 row)

CREATE INDEX
COMMIT
[bmaddox@girls ANRC]$

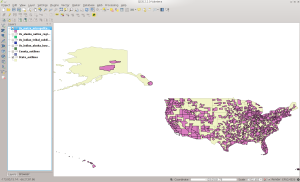
Here is the screenshot of how the data should look in QGIS:

ANRC Dataset

ANRC Dataset

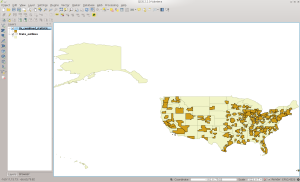
Next change to the CBSA directory. This contains the combined Metropolitan and Micropolitan statistical areas. As before, here are the commands and you will replace things with information specific to your setup:

[bmaddox@girls census]$ cd CBSA/
[bmaddox@girls CBSA]$ ls -l
total 28960
-rwxrw-r-x 1 bmaddox bmaddox 29654427 Aug 16 2013 tl_2013_us_cbsa.zip
[bmaddox@girls CBSA]$ unzip tl_2013_us_cbsa.zip 
Archive: tl_2013_us_cbsa.zip
inflating: tl_2013_us_cbsa.dbf 
inflating: tl_2013_us_cbsa.prj 
inflating: tl_2013_us_cbsa.shp 
inflating: tl_2013_us_cbsa.shp.xml 
inflating: tl_2013_us_cbsa.shx 
[bmaddox@girls CBSA]$ ls -l
total 75708
-rwxrwxr-x 1 bmaddox bmaddox 254035 Aug 6 2013 tl_2013_us_cbsa.dbf
-rwxrwxr-x 1 bmaddox bmaddox 165 Aug 6 2013 tl_2013_us_cbsa.prj
-rwxrwxr-x 1 bmaddox bmaddox 47575788 Aug 6 2013 tl_2013_us_cbsa.shp
-rwxrwxr-x 1 bmaddox bmaddox 17767 Aug 6 2013 tl_2013_us_cbsa.shp.xml
-rwxrwxr-x 1 bmaddox bmaddox 7532 Aug 6 2013 tl_2013_us_cbsa.shx
-rwxrw-r-x 1 bmaddox bmaddox 29654427 Aug 16 2013 tl_2013_us_cbsa.zip
[bmaddox@girls CBSA]$ shp2pgsql -s 4269 -c -D -I -WLATIN1 tl_2013_us_cbsa.shp US_Metro_Micropolitan_Statistical_Areas |psql -d Census_2013 
Shapefile type: Polygon
Postgis type: MULTIPOLYGON[2]
SET
SET
BEGIN
NOTICE: CREATE TABLE will create implicit sequence "us_metro_micropolitan_statistical_areas_gid_seq" for serial column "us_metro_micropolitan_statistical_areas.gid"
CREATE TABLE
NOTICE: ALTER TABLE / ADD PRIMARY KEY will create implicit index "us_metro_micropolitan_statistical_areas_pkey" for table "us_metro_micropolitan_statistical_areas"
ALTER TABLE
addgeometrycolumn 
-----------------------------------------------------------------------------------------
public.us_metro_micropolitan_statistical_areas.geom SRID:4269 TYPE:MULTIPOLYGON DIMS:2 
(1 row)
CREATE INDEX
COMMIT
[bmaddox@girls CBSA]$

Here is how it looks in QGIS once loaded:

CBSA in QGIS

CBSA in QGIS

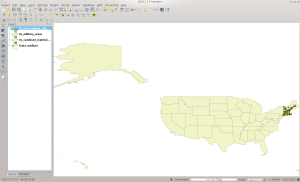
Now change to the CD directory. This dataset contains the 113th Congress Congressional districts.

[bmaddox@girls census]$ ls CD
tl_2013_us_cd113.zip
[bmaddox@girls census]$ cd CD/
[bmaddox@girls CD]$ ls -l
total 38528
-rwxrw-r-x 1 bmaddox bmaddox 39448037 Aug 16 2013 tl_2013_us_cd113.zip
[bmaddox@girls CD]$ unzip tl_2013_us_cd113.zip 
Archive: tl_2013_us_cd113.zip
inflating: tl_2013_us_cd113.dbf 
inflating: tl_2013_us_cd113.prj 
inflating: tl_2013_us_cd113.shp 
inflating: tl_2013_us_cd113.shp.xml 
inflating: tl_2013_us_cd113.shx 
[bmaddox@girls CD]$ ls -l
total 100132
-rwxrwxr-x 1 bmaddox bmaddox 50146 Aug 6 2013 tl_2013_us_cd113.dbf
-rwxrwxr-x 1 bmaddox bmaddox 165 Aug 6 2013 tl_2013_us_cd113.prj
-rwxrwxr-x 1 bmaddox bmaddox 62997500 Aug 6 2013 tl_2013_us_cd113.shp
-rwxrwxr-x 1 bmaddox bmaddox 19400 Aug 6 2013 tl_2013_us_cd113.shp.xml
-rwxrwxr-x 1 bmaddox bmaddox 3652 Aug 6 2013 tl_2013_us_cd113.shx
-rwxrw-r-x 1 bmaddox bmaddox 39448037 Aug 16 2013 tl_2013_us_cd113.zip
[bmaddox@girls CD]$ shp2pgsql -s 4269 -c -D -I tl_2013_us_cd113.shp US_113_Congress_Districts |psql -d Census_2013 
Shapefile type: Polygon
Postgis type: MULTIPOLYGON[2]
SET
SET
BEGIN
NOTICE: CREATE TABLE will create implicit sequence "us_113_congress_districts_gid_seq" for serial column "us_113_congress_districts.gid"
CREATE TABLE
NOTICE: ALTER TABLE / ADD PRIMARY KEY will create implicit index "us_113_congress_districts_pkey" for table "us_113_congress_districts"
ALTER TABLE
addgeometrycolumn 
---------------------------------------------------------------------------
public.us_113_congress_districts.geom SRID:4269 TYPE:MULTIPOLYGON DIMS:2 
(1 row)
CREATE INDEX
COMMIT
[bmaddox@girls CD]$
113th Congressional Districts

113th Congressional Districts

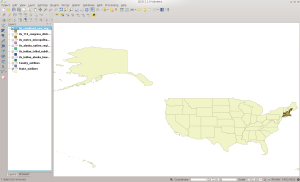
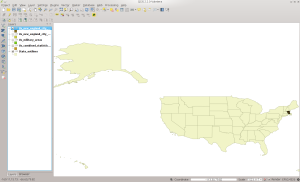
Now we move to the CNECTA directory.  This dataset is the Combined New England City and Town Areas dataset.

[bmaddox@girls census]$ ls CNECTA/
tl_2013_us_cnecta.zip
[bmaddox@girls census]$ cd CNECTA/
[bmaddox@girls CNECTA]$ ls -l
total 436
-rwxrw-r-x 1 bmaddox bmaddox 442433 Aug 16 2013 tl_2013_us_cnecta.zip
[bmaddox@girls CNECTA]$ unzip tl_2013_us_cnecta.zip 
Archive: tl_2013_us_cnecta.zip
inflating: tl_2013_us_cnecta.dbf 
inflating: tl_2013_us_cnecta.prj 
inflating: tl_2013_us_cnecta.shp 
inflating: tl_2013_us_cnecta.shp.xml 
inflating: tl_2013_us_cnecta.shx 
[bmaddox@girls CNECTA]$ ls -l
total 1128
-rwxrwxr-x 1 bmaddox bmaddox 1944 Aug 6 2013 tl_2013_us_cnecta.dbf
-rwxrwxr-x 1 bmaddox bmaddox 165 Aug 6 2013 tl_2013_us_cnecta.prj
-rwxrwxr-x 1 bmaddox bmaddox 679436 Aug 6 2013 tl_2013_us_cnecta.shp
-rwxrwxr-x 1 bmaddox bmaddox 16353 Aug 6 2013 tl_2013_us_cnecta.shp.xml
-rwxrwxr-x 1 bmaddox bmaddox 148 Aug 6 2013 tl_2013_us_cnecta.shx
-rwxrw-r-x 1 bmaddox bmaddox 442433 Aug 16 2013 tl_2013_us_cnecta.zip
[bmaddox@girls CNECTA]$ shp2pgsql -s 4269 -c -D -I tl_2013_us_cnecta.shp US_Combined_New_England_City_Town_Areas |psql -d Census_2013 
Shapefile type: Polygon
Postgis type: MULTIPOLYGON[2]
SET
SET
BEGIN
NOTICE: CREATE TABLE will create implicit sequence "us_combined_new_england_city_town_areas_gid_seq" for serial column "us_combined_new_england_city_town_areas.gid"
CREATE TABLE
NOTICE: ALTER TABLE / ADD PRIMARY KEY will create implicit index "us_combined_new_england_city_town_areas_pkey" for table "us_combined_new_england_city_town_areas"
ALTER TABLE
addgeometrycolumn 
-----------------------------------------------------------------------------------------
public.us_combined_new_england_city_town_areas.geom SRID:4269 TYPE:MULTIPOLYGON DIMS:2 
(1 row)
CREATE INDEX
COMMIT
[bmaddox@girls CNECTA]$

The loaded data should look similar to below:

CNECTA Dataset

CNECTA Dataset

Next we move on to the COAST directory. This is the US Coastline data derived from Census edges.

[bmaddox@girls census]$ ls COAST/
tl_2013_us_coastline.zip
[bmaddox@girls census]$ cd COAST/
[bmaddox@girls COAST]$ ls -l
total 15792
-rwxrw-r-x 1 bmaddox bmaddox 16168901 Aug 16 2013 tl_2013_us_coastline.zip
[bmaddox@girls COAST]$ unzip tl_2013_us_coastline.zip
Archive: tl_2013_us_coastline.zip
inflating: tl_2013_us_coastline.dbf
inflating: tl_2013_us_coastline.prj
inflating: tl_2013_us_coastline.shp
inflating: tl_2013_us_coastline.shp.xml
inflating: tl_2013_us_coastline.shx
[bmaddox@girls COAST]$ ls -l
total 40272
-rwxrwxr-x 1 bmaddox bmaddox 449644 Aug 6 2013 tl_2013_us_coastline.dbf
-rwxrwxr-x 1 bmaddox bmaddox 165 Aug 6 2013 tl_2013_us_coastline.prj
-rwxrwxr-x 1 bmaddox bmaddox 24558540 Aug 6 2013 tl_2013_us_coastline.shp
-rwxrwxr-x 1 bmaddox bmaddox 15352 Aug 7 2013 tl_2013_us_coastline.shp.xml
-rwxrwxr-x 1 bmaddox bmaddox 34028 Aug 6 2013 tl_2013_us_coastline.shx
-rwxrw-r-x 1 bmaddox bmaddox 16168901 Aug 16 2013 tl_2013_us_coastline.zip
[bmaddox@girls COAST]$ shp2pgsql -s 4269 -c -D -I -WLATIN1 tl_2013_us_coastline.shp US_Coastlines |psql -d Census_2013
Shapefile type: Arc
Postgis type: MULTILINESTRING[2]
SET
SET
BEGIN
NOTICE: CREATE TABLE will create implicit sequence "us_coastlines_gid_seq" for serial column "us_coastlines.gid"
CREATE TABLE
NOTICE: ALTER TABLE / ADD PRIMARY KEY will create implicit index "us_coastlines_pkey" for table "us_coastlines"
ALTER TABLE
addgeometrycolumn
 ------------------------------------------------------------------
public.us_coastlines.geom SRID:4269 TYPE:MULTILINESTRING DIMS:2
(1 row)
CREATE INDEX
COMMIT
[bmaddox@girls COAST]$

The coastlines will look like this:

COAST in QGIS

COAST in QGIS

We now move to the CSA directory, which holds the combined statistical area national-level shapefile. These are generally areas where several large cities are combined into a single statistical unit, such as the Branson-Springfield area in Missouri.

[bmaddox@girls census]$ ls CSA
tl_2013_us_csa.zip
[bmaddox@girls census]$ cd CSA/
[bmaddox@girls CSA]$ ls -l
total 10020
-rwxrw-r-x 1 bmaddox bmaddox 10259685 Aug 16 2013 tl_2013_us_csa.zip [bmaddox@girls CSA]$ unzip tl_2013_us_csa.zip
Archive: tl_2013_us_csa.zip
inflating: tl_2013_us_csa.dbf
inflating: tl_2013_us_csa.prj
inflating: tl_2013_us_csa.shp
inflating: tl_2013_us_csa.shp.xml
inflating: tl_2013_us_csa.shx
[bmaddox@girls CSA]$ ls -l
total 26184
-rwxrwxr-x 1 bmaddox bmaddox 45139 Aug 6 2013 tl_2013_us_csa.dbf
-rwxrwxr-x 1 bmaddox bmaddox 165 Aug 6 2013 tl_2013_us_csa.prj
-rwxrwxr-x 1 bmaddox bmaddox 16477264 Aug 6 2013 tl_2013_us_csa.shp -rwxrwxr-x 1 bmaddox bmaddox 16012 Aug 6 2013 tl_2013_us_csa.shp.xml -rwxrwxr-x 1 bmaddox bmaddox 1452 Aug 6 2013 tl_2013_us_csa.shx
-rwxrw-r-x 1 bmaddox bmaddox 10259685 Aug 16 2013 tl_2013_us_csa.zip [bmaddox@girls CSA]$ shp2pgsql -s 4269 -c -D -I -WLATIN1 tl_2013_us_csa.shp US_Combined_Statistical_Areas |psql -d Census_2013
Shapefile type: Polygon
Postgis type: MULTIPOLYGON[2]
SET
SET
BEGIN
NOTICE: CREATE TABLE will create implicit sequence "us_combined_statistical_areas_gid_seq" for serial column "us_combined_statistical_areas.gid"
CREATE TABLE
NOTICE: ALTER TABLE / ADD PRIMARY KEY will create implicit index "us_combined_statistical_areas_pkey" for table "us_combined_statistical_areas"
ALTER TABLE
addgeometrycolumn
-------------------------------------------------------------------------------
public.us_combined_statistical_areas.geom SRID:4269 TYPE:MULTIPOLYGON DIMS:2
(1 row)
CREATE INDEX
COMMIT
[bmaddox@girls CSA]$

Once loaded, it should look like this in QGIS:

CSA in QGIS

CSA in QGIS

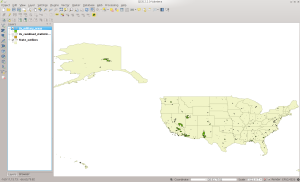
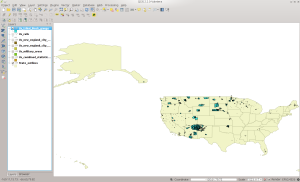
The MIL directory contains areas that are classified as belonging to the US Military… that we know about at least.

[bmaddox@girls census]$ cd MIL/
[bmaddox@girls MIL]$ dir
total 2904
-rwxrw-r-x 1 bmaddox bmaddox 2973061 Aug 16 2013 tl_2013_us_mil.zip
[bmaddox@girls MIL]$ unzip tl_2013_us_mil.zip
Archive: tl_2013_us_mil.zip
inflating: tl_2013_us_mil.dbf
inflating: tl_2013_us_mil.prj
inflating: tl_2013_us_mil.shp
inflating: tl_2013_us_mil.shp.xml
inflating: tl_2013_us_mil.shx
[bmaddox@girls MIL]$ ls -l
total 7628
-rwxrwxr-x 1 bmaddox bmaddox 150451 Aug 6 2013 tl_2013_us_mil.dbf
-rwxrwxr-x 1 bmaddox bmaddox 165 Aug 6 2013 tl_2013_us_mil.prj
-rwxrwxr-x 1 bmaddox bmaddox 4653712 Aug 6 2013 tl_2013_us_mil.shp
-rwxrwxr-x 1 bmaddox bmaddox 15575 Aug 6 2013 tl_2013_us_mil.shp.xml
-rwxrwxr-x 1 bmaddox bmaddox 6524 Aug 6 2013 tl_2013_us_mil.shx
-rwxrw-r-x 1 bmaddox bmaddox 2973061 Aug 16 2013 tl_2013_us_mil.zip
[bmaddox@girls MIL]$ shp2pgsql -s 4269 -c -D -I tl_2013_us_mil.shp US_Military_Areas |psql -d Census_2013
Shapefile type: Polygon
Postgis type: MULTIPOLYGON[2]
SET
SET
BEGIN
NOTICE: CREATE TABLE will create implicit sequence "us_military_areas_gid_seq" for serial column "us_military_areas.gid"
CREATE TABLE
NOTICE: ALTER TABLE / ADD PRIMARY KEY will create implicit index "us_military_areas_pkey" for table "us_military_areas"
ALTER TABLE
addgeometrycolumn
-------------------------------------------------------------------
public.us_military_areas.geom SRID:4269 TYPE:MULTIPOLYGON DIMS:2
(1 row)
CREATE INDEX
COMMIT
[bmaddox@girls MIL]$

And it looks like this in QGIS:

MIL in QGIS

MIL in QGIS

Now to NECTA, which is the New England City and Town Areas.

[bmaddox@girls census]$ cd NECTA
[bmaddox@girls NECTA]$ ls
tl_2013_us_necta.zip
[bmaddox@girls NECTA]$ unzip tl_2013_us_necta.zip
Archive: tl_2013_us_necta.zip
inflating: tl_2013_us_necta.dbf
inflating: tl_2013_us_necta.prj
inflating: tl_2013_us_necta.shp
inflating: tl_2013_us_necta.shp.xml
inflating: tl_2013_us_necta.shx
[bmaddox@girls NECTA]$ shp2pgsql -s 4269 -c -D -I tl_2013_us_necta.shp US_New_England_City_Town_Areas |psql -d Census_2013
Shapefile type: Polygon
Postgis type: MULTIPOLYGON[2]
SET
SET
BEGIN
NOTICE: CREATE TABLE will create implicit sequence "us_new_england_city_town_areas_gid_seq" for serial column "us_new_england_city_town_areas.gid"
CREATE TABLE
NOTICE: ALTER TABLE / ADD PRIMARY KEY will create implicit index "us_new_england_city_town_areas_pkey" for table "us_new_england_city_town_areas"
ALTER TABLE
addgeometrycolumn
--------------------------------------------------------------------------------
public.us_new_england_city_town_areas.geom SRID:4269 TYPE:MULTIPOLYGON DIMS:2
(1 row)
CREATE INDEX
COMMIT
[bmaddox@girls NECTA]$

Which looks like this in QGIS:

NECTA in QGIS

NECTA in QGIS

And the NECTADIV, which are the divisions in the NECTA dataset.

[bmaddox@girls census]$ cd NECTADIV/
[bmaddox@girls NECTADIV]$ dir
total 184
-rwxrw-r-x 1 bmaddox bmaddox 186486 Aug 16 2013 tl_2013_us_nectadiv.zip
[bmaddox@girls NECTADIV]$ unzip tl_2013_us_nectadiv.zip
Archive: tl_2013_us_nectadiv.zip
inflating: tl_2013_us_nectadiv.dbf
inflating: tl_2013_us_nectadiv.prj
inflating: tl_2013_us_nectadiv.shp
inflating: tl_2013_us_nectadiv.shp.xml
inflating: tl_2013_us_nectadiv.shx
[bmaddox@girls NECTADIV]$ shp2pgsql -s 4269 -c -D -I tl_2013_us_nectadiv.shp US_New_England_City_Town_Divisions |psql -d Census_2013
Shapefile type: Polygon
Postgis type: MULTIPOLYGON[2]
SET
SET
BEGIN
NOTICE: CREATE TABLE will create implicit sequence "us_new_england_city_town_divisions_gid_seq" for serial column "us_new_england_city_town_divisions.gid"
CREATE TABLE
NOTICE: ALTER TABLE / ADD PRIMARY KEY will create implicit index "us_new_england_city_town_divisions_pkey" for table "us_new_england_city_town_divisions"
ALTER TABLE
addgeometrycolumn
------------------------------------------------------------------------------------
public.us_new_england_city_town_divisions.geom SRID:4269 TYPE:MULTIPOLYGON DIMS:2
(1 row)
CREATE INDEX
COMMIT
[bmaddox@girls NECTADIV]$

QGIS Screenshot:

NECTADIV in QGIS

NECTADIV in QGIS

RAILS contains, you guessed it, the national-level file of US railroads.

[bmaddox@girls RAILS]$ dir
total 40660
-rwxrw-r-x 1 bmaddox bmaddox 41634270 Aug 16 2013 tl_2013_us_rails.zip
[bmaddox@girls RAILS]$ unzip tl_2013_us_rails.zip
Archive: tl_2013_us_rails.zip
inflating: tl_2013_us_rails.dbf
inflating: tl_2013_us_rails.prj
inflating: tl_2013_us_rails.shp
inflating: tl_2013_us_rails.shp.xml
inflating: tl_2013_us_rails.shx
[bmaddox@girls RAILS]$ ls -l
total 130320
-rwxrwxr-x 1 bmaddox bmaddox 23419778 Aug 6 2013 tl_2013_us_rails.dbf
-rwxrwxr-x 1 bmaddox bmaddox 165 Aug 6 2013 tl_2013_us_rails.prj
-rwxrwxr-x 1 bmaddox bmaddox 66902500 Aug 6 2013 tl_2013_us_rails.shp
-rwxrwxr-x 1 bmaddox bmaddox 15759 Aug 6 2013 tl_2013_us_rails.shp.xml
-rwxrwxr-x 1 bmaddox bmaddox 1463828 Aug 6 2013 tl_2013_us_rails.shx
-rwxrw-r-x 1 bmaddox bmaddox 41634270 Aug 16 2013 tl_2013_us_rails.zip
[bmaddox@girls RAILS]$ shp2pgsql -s 4269 -c -D -I tl_2013_us_rails.shp US_Rails |psql -d Census_2013
Shapefile type: Arc
Postgis type: MULTILINESTRING[2]
SET
SET
BEGIN
NOTICE: CREATE TABLE will create implicit sequence "us_rails_gid_seq" for serial column "us_rails.gid"
CREATE TABLE
NOTICE: ALTER TABLE / ADD PRIMARY KEY will create implicit index "us_rails_pkey" for table "us_rails"
ALTER TABLE
addgeometrycolumn
-------------------------------------------------------------
public.us_rails.geom SRID:4269 TYPE:MULTILINESTRING DIMS:2
(1 row)
CREATE INDEX
COMMIT
[bmaddox@girls RAILS]$

In QGIS:

RAILS in QGIS

RAILS in QGIS

Next is TBG, which are national-level Tribal Block Groups.

[bmaddox@girls census]$ cd TBG/
[bmaddox@girls TBG]$ ls -l
total 16208
-rwxrwxr-x 1 bmaddox bmaddox 90939 Aug 6 2013 tl_2013_us_tbg.dbf
-rwxrwxr-x 1 bmaddox bmaddox 165 Aug 6 2013 tl_2013_us_tbg.prj
rwxrwxr-x 1 bmaddox bmaddox 16468896 Aug 6 2013 tl_2013_us_tbg.shp
-rwxrwxr-x 1 bmaddox bmaddox 17719 Aug 6 2013 tl_2013_us_tbg.shp.xml
-rwxrwxr-x 1 bmaddox bmaddox 7420 Aug 6 2013 tl_2013_us_tbg.shx
[bmaddox@girls TBG]$ shp2pgsql -s 4269 -c -D -I tl_2013_us_tbg.shp US_Tribal_Block_Groups |psql -d Census_2013
Shapefile type: Polygon
Postgis type: MULTIPOLYGON[2]
SET
SET
BEGIN
NOTICE: CREATE TABLE will create implicit sequence "us_tribal_block_groups_gid_seq" for serial column "us_tribal_block_groups.gid"
CREATE TABLE
NOTICE: ALTER TABLE / ADD PRIMARY KEY will create implicit index "us_tribal_block_groups_pkey" for table "us_tribal_block_groups"
ALTER TABLE
addgeometrycolumn
------------------------------------------------------------------------
public.us_tribal_block_groups.geom SRID:4269 TYPE:MULTIPOLYGON DIMS:2
(1 row)
CREATE INDEX
COMMIT
[bmaddox@girls TBG]$

In QGIS:

TBG in QGIS

TBG in QGIS

UAC contains the Urban Areas from the 2010 Census.

[bmaddox@girls census]$ cd UAC
[bmaddox@girls UAC]$ unzip tl_2013_us_uac10.zip
Archive: tl_2013_us_uac10.zip
inflating: tl_2013_us_uac10.dbf
inflating: tl_2013_us_uac10.prj
inflating: tl_2013_us_uac10.shp
inflating: tl_2013_us_uac10.shp.xml
inflating: tl_2013_us_uac10.shx
[bmaddox@girls UAC]$ ls -l
total 211884
-rwxrwxr-x 1 bmaddox bmaddox 976289 Jul 26 2013 tl_2013_us_uac10.dbf
-rwxrwxr-x 1 bmaddox bmaddox 165 Jul 26 2013 tl_2013_us_uac10.prj
-rwxrwxr-x 1 bmaddox bmaddox 132331308 Jul 26 2013 tl_2013_us_uac10.shp
-rwxrwxr-x 1 bmaddox bmaddox 17734 Aug 2 2013 tl_2013_us_uac10.shp.xml
-rwxrwxr-x 1 bmaddox bmaddox 28908 Jul 26 2013 tl_2013_us_uac10.shx
-rwxrw-r-x 1 bmaddox bmaddox 83595662 Aug 16 2013 tl_2013_us_uac10.zip
[bmaddox@girls UAC]$ shp2pgsql -s 4269 -c -D -I -WLATIN1 tl_2013_us_uac10.shp US_Urban_Areas_2010 |psql -d Census_2013
Shapefile type: Polygon
Postgis type: MULTIPOLYGON[2]
SET
SET
BEGIN
NOTICE: CREATE TABLE will create implicit sequence "us_urban_areas_2010_gid_seq" for serial column "us_urban_areas_2010.gid"
CREATE TABLE
NOTICE: ALTER TABLE / ADD PRIMARY KEY will create implicit index "us_urban_areas_2010_pkey" for table "us_urban_areas_2010"
ALTER TABLE
addgeometrycolumn
---------------------------------------------------------------------
public.us_urban_areas_2010.geom SRID:4269 TYPE:MULTIPOLYGON DIMS:2
(1 row)
CREATE INDEX
COMMIT
[bmaddox@girls UAC]$

QGIS:

UAC in QGIS

UAC in QGIS

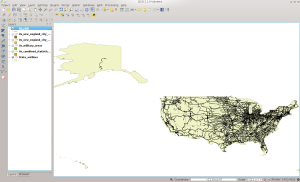
Next we will do the PRIMARYROADS dataset, which can be thought of as basically major US Interstates.

[bmaddox@girls census]$ ls -l PRIMARYROADS/
total 25364
-rwxrw-r-x 1 bmaddox bmaddox 25969141 Aug 16 2013 tl_2013_us_primaryroads.zip
[bmaddox@girls census]$ cd PRIMARYROADS/
[bmaddox@girls PRIMARYROADS]$ ls -l
total 25364
-rwxrw-r-x 1 bmaddox bmaddox 25969141 Aug 16 2013 tl_2013_us_primaryroads.zip
[bmaddox@girls PRIMARYROADS]$ unzip tl_2013_us_primaryroads.zip
Archive: tl_2013_us_primaryroads.zip
inflating: tl_2013_us_primaryroads.dbf
inflating: tl_2013_us_primaryroads.prj
inflating: tl_2013_us_primaryroads.shp
inflating: tl_2013_us_primaryroads.shp.xml
inflating: tl_2013_us_primaryroads.shx
[bmaddox@girls PRIMARYROADS]$ ls -l
total 66828
-rwxrwxr-x 1 bmaddox bmaddox 1633818 Aug 6 2013 tl_2013_us_primaryroads.dbf
-rwxrwxr-x 1 bmaddox bmaddox 165 Aug 6 2013 tl_2013_us_primaryroads.prj
-rwxrwxr-x 1 bmaddox bmaddox 40696696 Aug 6 2013 tl_2013_us_primaryroads.shp
-rwxrwxr-x 1 bmaddox bmaddox 16481 Aug 6 2013 tl_2013_us_primaryroads.shp.xml
-rwxrwxr-x 1 bmaddox bmaddox 101412 Aug 6 2013 tl_2013_us_primaryroads.shx
-rwxrw-r-x 1 bmaddox bmaddox 25969141 Aug 16 2013 tl_2013_us_primaryroads.zip
[bmaddox@girls PRIMARYROADS]$ shp2pgsql -s 4269 -c -D -I -WLATIN1 tl_2013_us_primaryroads.shp US_Primary_Roads |psql -d Census_2013 Shapefile type: Arc
Postgis type: MULTILINESTRING[2]
SET
SET
BEGIN
NOTICE: CREATE TABLE will create implicit sequence "us_primary_roads_gid_seq" for serial column "us_primary_roads.gid" CREATE TABLE
NOTICE: ALTER TABLE / ADD PRIMARY KEY will create implicit index "us_primary_roads_pkey" for table "us_primary_roads"
ALTER TABLE
addgeometrycolumn
---------------------------------------------------------------------
public.us_primary_roads.geom SRID:4269 TYPE:MULTILINESTRING DIMS:2 (1 row)
CREATE INDEX
COMMIT
[bmaddox@girls PRIMARYROADS]$

And in QGIS:

PRIMARYROADS in QGIS

PRIMARYROADS in QGIS

And finally (yes FINALLY!), the ZCTA5 dataset, which is the list of US zip code tabulation areas.

[bmaddox@girls census]$ cd ZCTA5/
[bmaddox@girls ZCTA5]$ dir
total 513180
-rwxrw-r-x 1 bmaddox bmaddox 525492077 Aug 16 2013 tl_2013_us_zcta510.zip
[bmaddox@girls ZCTA5]$ unzip tl_2013_us_zcta510.zip
Archive: tl_2013_us_zcta510.zip
inflating: tl_2013_us_zcta510.dbf
inflating: tl_2013_us_zcta510.prj
inflating: tl_2013_us_zcta510.shp
inflating: tl_2013_us_zcta510.shp.xml
inflating: tl_2013_us_zcta510.shx
[bmaddox@girls ZCTA5]$ shp2pgsql -s 4269 -c -D -I -WLATIN1 tl_2013_us_zcta510.shp US_Zip_Code_Areas |psql -d Census_2013
Shapefile type: Polygon
Postgis type: MULTIPOLYGON[2]
SET
SET
BEGIN
NOTICE: CREATE TABLE will create implicit sequence "us_zip_code_areas_gid_seq" for serial column "us_zip_code_areas.gid"
CREATE TABLE
NOTICE: ALTER TABLE / ADD PRIMARY KEY will create implicit index "us_zip_code_areas_pkey" for table "us_zip_code_areas"
ALTER TABLE
addgeometrycolumn
------------------------------------------------------------------- public.us_zip_code_areas.geom SRID:4269 TYPE:MULTIPOLYGON DIMS:2
(1 row)
CREATE INDEX
COMMIT
[bmaddox@girls ZCTA5]$

And the final screen shot:

ZCTA5 in QGIS

ZCTA5 in QGIS

So that is it. You now have the US state borders, county outlines, and a large amount of national-level data such as railroads and interstates. In 8.3 we will tackle some of the other datasets that are comprised of multiple county files for each state. We will convert them to single state files and then import them into PostGIS. Until then, examine and experiment with what you have just done and see what data is actually inside the tables.

Posted in GIS

Using Free Geospatial Tools and Data Part 8.1: US Census TIGER Data

In this installment we focus on downloading, condensing, and uploading US Census TIGER data into PostGIS. The complete TIGER dataset is very large, and you should allocate enough time and space to download it all. As we go along, I will let you know how big a download you can expect and how much temporary space you will need to process them. I will be describing how to download, convert, and upload the files using my Ubuntu system. The instructions will be a bit different using Windows and you should consult your documentation as to how the utilities run there. I will be using the lftp program to download the files, tools from GDAL to do the processing, and shp2pgsql from PostGIS to upload the data.

The Census portion of the series covers a lot of information, so I am breaking it up into multiple parts to avoid having you fall asleep while reading a large document. This part focuses on the layout of the Census FTP site and what files are contained in each directory. I am also including pointers to the full Census TIGER documentation for a reading assignment. At the end, I will go over importing the Census state outlines so you at least have something to look at until next time.

I will be posting my own conversions of the TIGER dataset to this website. The Census puts data out at a county level. Personally, I prefer having the data at a state level and that is also how I import it into PostGIS. Plus, having it backed up at the state level is handy in case you accidentally blow away your data like I may have done just recently while preparing for this part of the series. So if you like, you could read along and then just download the condensed file from my site if you do not feel like running the conversions on your own.

At the time of this writing, the latest version of the data is 2013 and is available at http://www.census.gov/geo/maps-data/data/tiger-line.html. The Census makes the data available for download in Shapefile format inside of zip files for each county or national organizational unit. The first thing you should do is skim through the full technical documentation that is available in PDF format here. This document describes the data model used in the various file sets and what each field means inside the various files. It also describes what the files contain and their naming convention. This information is very useful if you intend to do more than just load data to look at a map.
We will be downloading the data from the main FTP site here. I will be using the lftp program under Linux to download the files, as it provides an easy way to download entire directories at a time. On Windows there are similar download managers you can use to accomplish the same task. When you ftp to the above site, you will see the following directory structure:

lftp ftp2.census.gov:/geo/tiger/TIGER2013> dir
-rw-rw-r-- 1 holla301 i-geo 228662 Aug 21 2013 2013-FolderNames-Defined.pdf
drwxrwsr-x 2 holla301 i-geo 143360 Aug 16 2013 ADDR
drwxrwsr-x 2 holla301 i-geo 167936 Aug 16 2013 ADDRFEAT
drwxrwsr-x 2 holla301 i-geo 143360 Aug 16 2013 ADDRFN
drwxrwsr-x 2 holla301 i-geo 4096 Aug 16 2013 AIANNH
drwxrwsr-x 2 holla301 i-geo 4096 Aug 16 2013 AITS
drwxrwsr-x 2 holla301 i-geo 4096 Aug 16 2013 ANRC
drwxrwsr-x 2 holla301 i-geo 4096 Aug 16 2013 AREALM
drwxrwsr-x 2 holla301 i-geo 167936 Aug 16 2013 AREAWATER
drwxrwsr-x 2 holla301 i-geo 4096 Aug 16 2013 BG
drwxrwsr-x 2 holla301 i-geo 4096 Aug 16 2013 CBSA
drwxrwsr-x 2 holla301 i-geo 4096 Aug 16 2013 CD
drwxrwsr-x 2 holla301 i-geo 4096 Aug 16 2013 CNECTA
drwxrwsr-x 2 holla301 i-geo 4096 Aug 16 2013 COAST
drwxrwsr-x 2 holla301 i-geo 4096 Aug 16 2013 CONCITY
drwxrwsr-x 2 holla301 i-geo 4096 Aug 16 2013 COUNTY
drwxrwsr-x 2 holla301 i-geo 4096 Aug 16 2013 COUSUB
drwxrwsr-x 2 holla301 i-geo 4096 Aug 16 2013 CSA
drwxrwsr-x 2 holla301 i-geo 135168 Aug 16 2013 EDGES
drwxrwsr-x 2 holla301 i-geo 4096 Aug 16 2013 ELSD
drwxrwsr-x 2 holla301 i-geo 4096 Aug 16 2013 ESTATE
drwxrwsr-x 2 holla301 i-geo 147456 Sep 13 12:24 FACES
drwxrwsr-x 2 holla301 i-geo 172032 Aug 16 2013 FACESAH
drwxrwsr-x 2 holla301 i-geo 4096 Aug 16 2013 FACESAL
drwxrwsr-x 2 holla301 i-geo 4096 Aug 16 2013 FACESMIL
drwxrwsr-x 2 holla301 i-geo 163840 Aug 16 2013 FEATNAMES
drwxrwsr-x 2 holla301 i-geo 180224 Aug 16 2013 LINEARWATER
drwxrwsr-x 2 holla301 i-geo 4096 Aug 16 2013 METDIV
drwxrwsr-x 2 holla301 i-geo 4096 Aug 16 2013 MIL
drwxrwsr-x 2 holla301 i-geo 4096 Aug 16 2013 NECTA
drwxrwsr-x 2 holla301 i-geo 4096 Aug 16 2013 NECTADIV
drwxrwsr-x 2 holla301 i-geo 126976 Aug 16 2013 OTHERID
drwxrwsr-x 2 holla301 i-geo 4096 Aug 16 2013 PLACE
drwxrwsr-x 2 holla301 i-geo 4096 Aug 16 2013 POINTLM
drwxrwsr-x 2 holla301 i-geo 4096 Aug 16 2013 PRIMARYROADS
drwxrwsr-x 2 holla301 i-geo 4096 Aug 16 2013 PRISECROADS
drwxrwsr-x 2 holla301 i-geo 4096 Aug 16 2013 PUMA
drwxrwsr-x 2 holla301 i-geo 4096 Aug 16 2013 RAILS
drwxrwsr-x 2 holla301 i-geo 155648 Aug 16 2013 ROADS
drwxrwsr-x 2 holla301 i-geo 4096 Aug 16 2013 SCSD
drwxrwsr-x 2 holla301 i-geo 4096 Aug 16 2013 SLDL
drwxrwsr-x 2 holla301 i-geo 4096 Aug 16 2013 SLDU
drwxrwsr-x 2 holla301 i-geo 4096 Aug 16 2013 STATE
drwxrwsr-x 2 holla301 i-geo 4096 Aug 16 2013 SUBMCD
drwxrwsr-x 2 holla301 i-geo 4096 Aug 16 2013 TABBLOCK
drwxrwsr-x 2 holla301 i-geo 4096 Aug 16 2013 TBG
drwxrwsr-x 2 holla301 i-geo 4096 Aug 16 2013 TRACT
drwxrwsr-x 2 holla301 i-geo 4096 Aug 16 2013 TTRACT
drwxrwsr-x 2 holla301 i-geo 4096 Aug 16 2013 UAC
drwxrwsr-x 2 holla301 i-geo 4096 Aug 16 2013 UNSD
drwxrwsr-x 2 holla301 i-geo 4096 Aug 16 2013 ZCTA5

As to what these directories contain, here is a summary taken from the TIGER documentation. As we load each file type, I will cover what the files contain in more detail.

  • ADDR – Address Range Relationship File. These files contain DBF files that contain address information for each edge in the dataset. For each edge, it lists the from- and to- house numbers, which side of the road they are on, the ZIP, and ZIP+4 codes.
  • ADDRFEAT – Address Range Feature File. These files are Shapefiles that contain information similar to the above and other metadata such as street names.
  • ADDRFN – Address Range-Feature Name Relationship File. Each file maps the relationship between address range and linear feature identifiers.
  • AIANNH – American Indian / Alaska Native / Native Hawaiian Areas. This national-level file contains federally-recognized American Indian reservations and off-reservation trust land areas, state-recognized reservations, and Hawaiian home land areas for which the Census publishes data.
  • AITSN – American Indian Tribal Subdivision National. Another national-level file that contains legally defined administrative subdivisions of federally-recognized American Indian reservations, off-reservation trust lands, or Oklahoma tribal statistical areas.
  • ANRC – Alaska Native Regional Corporation. These are areas that define corporate entities established to conduct both business and nonprofit affairs of the Alaska Natives pursuant to the Alaska Native Claims Settlement Act of 1972.
  • AREALM – Area Landmarks. These files contain area landmarks that the Census records for locating special features and to help enumerators during field operations (parks, schools, etc).
  • AREAWATER – Area Water. These contain polygonal area definitions of water (or hydrographic) features such as lakes, ponds, and rivers.
  • BG – Block Groups. These are Census-specific clusters of blocks that have the same first digit of their four-digit identifying numbers within a Census Tract.
  • CBSA – Metropolitan Statistical Area / Micropolitan Statistical Area. These Shapefiles contain the 2013 county and equivalent entities and contain fields with codes for combined, metropolitan, or micropolitan statistical areas and metropolitan divisions.
  • CD – Congressional District. These are area definitions of the 113th Congressional Districts.
  • CNECTA – Combined New England City and Town Area. These files contain the Office of Management and Budget (OMB)-defined alternative county subdivision-based definitions of statistical areas known as New England city and town areas.
  • COASTLINE – US Coastlines. This is a new addition that is a national-level file of linear coastline features.
  • CONCITY – Consolidated Cities. These are defined as units of local governments for which the functions of the incorporated place and its county or minor civil division have merged.
  • COUNTY – US Counties. This is a national-level file containing the definitions for counties within the US and its territories.
  • COUSUB – County Subdivision. These are statistical subdivisions of boroughs, city nad boroughs, municipalities, and census areas.
  • CSA – Combined Statistical Area. These are groups of two or more areas that have significant employment interchanges.
  • EDGES – All linear edges in the dataset. These data contain every edge that the Census has recorded, be it road, rail, or water features.
  • ELSD – Elementary School District. These are area definitions that define locality-recognized elementary school districts.
  • ESTATE – Estates. These are subdivisions of the three major islands in the United States Virgin Islands that have legally defined boundaries and are generally smaller in area than the Census subdistricts.
  • FACES – Topological Faces (Polygons With All Geocodes). Faces are areal objects that are bounded by one or more edges and are topological primitives. A face is not internally subdivided by edges into smaller polygons but may completely surround other faces (such as islands).
  • FACESAH – Topological Faces-Area Hydrography Relationship File. These are face areas that contain a water feature relationship.
  • FACESAL – Topological Faces-Area Landmark Relationship File. These are face areas that contain a landmark feature relationship.
  • FACESMIL – Topological Faces-Military Installation Relationship File. These are face areas that contain a military feature relationship.
  • FEATNAMES – Feature Names Relationship File. These files contain a record for each feature name-edge combination and includes the feature name attributes. This file may contain alternative names for linear features.
  • LINEARWATER – Linear Water. This file contains linear features where the edge represents a water feature.
  • METDIV – Metropolitan Division. These files represent metropolitan statistical areas containing a single core with a population of at least 2.5 million people and is subdivided to form smaller groupings of counties or equivalent entities.
  • MIL – Military Installations. This is a national-level file denoting US military installations.
  • NECTA – New England City and Town Area. These files contain the areas covered by the OMB for Combined New England city and town areas.
  • NECTADIV – New England City and Town Area Division. These areas are created when a NECTA containing a single core with a population of at least 2.5 million is to form smaller groupings of cities and towns.
  • OTHERID – Other Identifiers. This file contains external identifier codes and individual county identifiers between the permanent edge identifier attribute in the EDGES file and the identifier listed here.
  • PLACE – Places. These files contain geography and attributes at the state level of both incorporated places and census designated places.
  • POINTLM – Point Landmarks. These are point features that are used to locate special features and to help enumerators during field operations. They contain points that identify areas such as airports, parks, and schools.
  • PRIMARYROADS – Primary Roads. These are defined as generally divided, limited-access highways within the Federal interstate highway system or under state management.
  • PRISECROADS – Primary and Secondary Roads. These files contain the primary roads and main arteries that are usually in a US, state, or county highway system with one or more lanes of traffic in each direction.
  • PUMA – Public Use Microdata Area. These are decennial census areas that have been definied for the tabulation and dissemination of public use microdata sample American Community Survey data.
  • RAILS – Railroads. These are linear edges that denote railroads at the national level.
  • ROADS – All roads. These files contain all roads (major or minor) in the US and its territories.
  • SCSD – Secondary School District. These are secondary school districts that are typically defined as between elementary school and college.
  • SLDL – State Legislative District – Lower Chamber. These areas denote state legislative districts that are equivalent to a house chamber.
  • SLDU – State Legislative District – Upper Chamber. These areas denote state legislative districts that are equivalent to a senate chamber.
  • STATE – State and Equivalent. These files contain the outlines of each state and territory in the US.
  • SUBBARRIO – SubMinor Civil Division (Subbarrios in Puerto Rico). These areas are legally defined divisions or minor civil divisions in Puerto Rico.
  • TABBLOCK – Tabulation (Census) Block. These areas are definied by the Census as statistical areas bounded on all sides by visible features, such as streets, roads, streams, railroad tracks, and by non-visible boundaries such as city, town, township, and county limits.
  • TBG – Tribal Block Group. These areas are clusters of blocks within the same tribal census tract.
  • TRACT – Census Tract. These areas are small, relatively permanent statistical subdivisions of a county or equivalent entity and are reviewed and updated by local participants prior to each decennial census as part of the Census Bureau’s Participant Statistical Areas Program.
  • TTRACT – Tribal Census Tract. These are relatively small statistical subdivisions of an American Indian reservation and/or off-reservation trust land and were defined by federally recognized tribal government officials working with the Census.
  • UAC – Urban Area/Urban Cluster. These are clusters consisting of densely developed territory that has between 2,500 and 50,000 people.
  • UNSD – Unified School District. These are pseudo-secondary school districts that represent regular unified school districts in areas where the unified school district share final responsibility with the elementary district.
  • ZCTA5 – 5-Digit ZIP Code Tabulation Area. These are approximate area representations of US Postal Service five digit ZIP code service areas that the Census creates using whole blocks to present statistical data from censuses and surveys.

Census State Outlines

We first need a database to hold all of the Census data. If you created a geospatial database template from earlier in this series, open a shell prompt and type:

createdb -T gistemplate Census_2013

Now that we have gone through all of that, the first dataset we will upload is only 8.3 megabytes in size. From the shell prompt, run:

mkdir census
cd census

Again from the shell prompt, run

lftp ftp://ftp2.census.gov/geo/tiger/TIGER2013.

You should see something similar to the below:

lftp ftp://ftp2.census.gov/geo/tiger/TIGER2013
cd ok, cwd=/geo/tiger/TIGER2013
lftp ftp2.census.gov:/geo/tiger/TIGER2013>

You can then type cls to get a shortened listing of the directories I just described. From inside the client, type:

mirror STATE/

lftp will download the file and once done you will see something like this:

lftp ftp2.census.gov:/geo/tiger/TIGER2013> mirror STATE/
Total: 1 directory, 1 file, 0 symlinks
New: 1 file, 0 symlinks
8599274 bytes transferred in 17 seconds (500.2K/s)
lftp ftp2.census.gov:/geo/tiger/TIGER2013>

You can now type quit and hit enter or type Control-D to exit lftp. Change into the directory STATE and you will see this file:

[bmaddox@girls STATE]$ ls -l
total 8400
-rwxrw-r-x 1 bmaddox bmaddox 8599274 Aug 16 2013 tl_2013_us_state.zip
[bmaddox@girls STATE]$

This follows the Census naming convention of:

  • tl = TIGER/Line
  • 2013 = the version of the files
  • us = parent geography entity ID code of the geographic extent, in this case US being the entire country.
  • State = layer tag for the dataset
  • zip = the file extension

Run unzip tl_2013_us_state.zip and you will then find these files in the STATE directory:

[bmaddox@girls STATE]$ unzip tl_2013_us_state.zip
Archive: tl_2013_us_state.zip
inflating: tl_2013_us_state.dbf
inflating: tl_2013_us_state.prj
inflating: tl_2013_us_state.shp
inflating: tl_2013_us_state.shp.xml
inflating: tl_2013_us_state.shx
[bmaddox@girls STATE]$ ls
tl_2013_us_state.dbf tl_2013_us_state.shp tl_2013_us_state.shx
tl_2013_us_state.prj tl_2013_us_state.shp.xml tl_2013_us_state.zip
[bmaddox@girls STATE]

These files make up the ESRI Shapefile format. For a more complete explanation of what each file is, consult the links to the format that I have posted previously in this series.

To upload the files to PostGIS with the proper geographic coordinates, we need to know the EPSG code of the data that defines its projection. All Census TIGER data uses the EPSG code 4269 which denotes the NAD83 datum.

From this directory, run the following command to create a table with the state outlines and your output should look similar to the below:

[bmaddox@girls STATE]$ shp2pgsql -s 4269 -c -D -I tl_2013_us_state.shp State_Outlines | psql -d Census_2013
Shapefile type: Polygon
Postgis type: MULTIPOLYGON[2]
SET
SET
BEGIN
NOTICE: CREATE TABLE will create implicit sequence "state_outlines_gid_seq" for serial column "state_outlines.gid"
CREATE TABLE
NOTICE: ALTER TABLE / ADD PRIMARY KEY will create implicit index "state_outlines_pkey" for table "state_outlines"
ALTER TABLE
addgeometrycolumn
----------------------------------------------------------------
public.state_outlines.geom SRID:4269 TYPE:MULTIPOLYGON DIMS:2
(1 row)

CREATE INDEX
COMMIT
[bmaddox@girls STATE]$

The options to the command line are:

  • -s = specify the EPSG code
  • -c = create a table
  • -D = use postgresql dump format (speeds things up basically)
  • -I = create a spatial index column. This column contains the coordinates of the line segments so a GIS can determine where they are
  • State_Outlines = the table name to create
  • | psql -d Census_2013 = takes the output from the shp2pgsql command and pipes it to the psql command using the Census_2013 database.

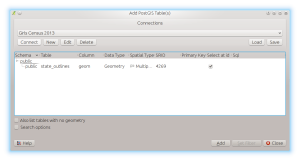
To view the data, run QGIS Desktop. As I discussed earlier in the series, open the load from PostGIS dialog and create an entry called Census_2013 with the hostname, database, user, and password for your specific setup. Once that is done, click Connect and expand the entries under the public schema and you should see something like this:

Census 2013 Table with State Outlines

Census 2013 Table with State Outlines

Click the state_outlines layer and then the Add button. After a second or two you should see this:

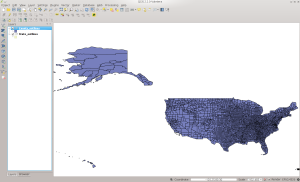
State Outlines table in QGIS

State Outlines table in QGIS

And that is it. Fairly easy, eh? You have just successfully learned a bit about the Census TIGER dataset, put data into PostGIS, and viewed it inside QGIS. You can right click on the layer in QGIS to view the attribute table to see what kind of data is stored for each state.

Next time, we will continue working through TIGER data to create your first large-scale geospatial database.

Posted in GIS

Using Free Geospatial Tools and Data Part 7: Data Sources for your Geospatial Database

We have finally gotten past the preliminaries, and this series now takes a turn towards what free geospatial data is available and how you can make use of them in free tools. The rest of this series will focus heavily on putting data into a geospatial database, PostGIS in this case. I will also be posting various bash scripts that I have written to make things easier when staging data for import. Many of the datasets are megabytes and gigabytes in size. Trying to use them as a series of files would be slow and very inefficient.

The whole reason people started putting data into geospatial databases is they wanted to use the ability to localize data and use relational query syntax to speed up fetching data. Geospatial databases can physically store data that is spatially near each other in the same locations on disk, commonly called clustering. Spatial indexes can be created that makes it easier for the database to locate information. Combine this with a query that only requests a subset of the data and suddenly you can manipulate large datasets with ease.

“Why would I want to make my own databases when I have Google?” you might ask yourself. You can only get so much out of Google Maps for free. If you make a lot of use of their servers, or if you use it for commercial purposes, you will have to pay. Map data you get back are pre-rendered raster tiles using their styling. Even OpenStreetMap serves up raster tiles already styled. You could use a lot of traffic going back and forth to their servers. If your bandwidth is metered, this could increase your out-of-pocket costs.

If you store the vector data yourself, you have access to the original data that was used to make up the raster tiles from Internet sources. You can do a lot with this type of information, from accurately measuring line segment distances to geolocating street addresses. More importantly, you have access to all the metadata that is in the vector data. You can get more than just a name about a point or area: you can find out who collected that point, when it was collected, and in some cases even who owns a point or area. You can style the data however you want. You can impress all your GIS geek friends. And best of all, you can use it as much as you want without having to pay anyone else.

This post is a bit of a foreshadowing of what is to come. I will provide pointers to the various datasets that will be covered. The idea is that you can read ahead and get a feel for what kinds of information each dataset contains. You might even be amazed at how much is out there.

The first dataset we will cover is the US Census Bureau’s Topologically Integrated Geographic Encoding and Referencing (TIGER) Dataset, which for US citizens is the granddaddy of them all. This dataset has been released since the 1990’s and is one of the original base datasets for OpenStreetMap in the USA. TIGER currently contains a large amount of metadata for each road segment such as left and right street address ranges, what zip codes they are in, and so on.

Next are the data from the OpenStreetMap project. This project was created in 2004 in the UK and has grown to include crowd-sourced data worldwide. It is maintained by volunteers and in many cases is more up to date than many traditional data source. Volunteers can contribute GPS traces or collect data off of aerial photography. In additional to roads, this dataset contains a huge amount of points of interest and trails.

The Natural Earth dataset is a public domain collection that is available at scales of 1:10m, 1:50m, and 1:110m. While not as comprehensive as OpenStreetMap, this dataset contains raster and vector data along with associated metadata. It also contains shaded relief maps that are combined with color-ramped elevation data derived from satellite imagery. It is maintained by the North American Cartographic Information Society (NACIS).

Combined, these three datasets will take up quite a bit of space on your system. You should expect to need at least 30 gigabytes of space on your system, more depending on if you import all of OpenStreetMap or not. We’ll cover that in later installments of this series.

In the meantime, follow the links I’ve posted, play around with tools such as QGIS, and get a feel for how things work.  Hit up the project web pages to learn more about the software and Google for more background if you’re coming into the GIS world fresh.

Posted in GIS

Using Free Geospatial Tools and Data Part 6.5: QGIS Documentation

So in the last installment I mentioned that I would do another article on QGIS.  However, after looking, there is such a large amount of documentation out there that I felt that I would just put links to some good online documents so I would not have to reinvent the wheel.  So here are a few links you can use to learn how to use QGIS as these articles will make use of it later on once I go into how to build your own large holdings of free geospatial data.

In addition to these, don’t forget to use your favorite search engine to look for QGIS tutorials.  Youtube also has a lot of videos where you can watch, instead of read, how to use QGIS.

Note:

Ok, I admit it.  I did it this way because I’m feeling lazy since I’m sick and figure I would just point to other great tutorials so I can move on to importing data from various sources.

Posted in GIS

Using Free Geospatial Tools and Data Part 6: QGIS

I took a brief vacation so have not updated this in a while. Switched distributions from Fedora KDE Spin back to Kubuntu and had the holidays hit. Then ended up finding out Kubuntu 13.10 did not have the latest QGIS so had to compile the packages for it myself. But now it is time to get back into the swing of things.

We last left off with setting up a geospatial database and putting a small sample Shapefile with a few points so you could get some experience with creating and storing data. However, now that the data is in the database, it would be handy to actually display it instead of just looking at the metadata about it.

Installing QGIS

QGIS is one of the leading open source GIS tools in existence. It can call functions from GRASS to use advanced functionality that is not built-in. It has a Python-based plug-in system with an extensive set of plug ins that perform raster and vector operations in addition to allowing one to use data from Google and Bing as a base map. Put this all together, and you have something that these days can actually take on and surpass the commercial GIS offerings out there.

Installing QGIS is very straight-forward these days. Windows installers can be found at the QGIS website that make use of Cygwin. Most Linux distributions have packages pre-built in their repositories. If you are on Ubuntu, I would recommend that you ignore my previous post on this blog, as the Ubuntu-GIS team has built packages and placed them into the ubuntugis-unstable repository. Do not be fooled by the unstable moniker. I have been using packages from there over the years and have never had any issues with them. Check your distribution repositories and package search tools to find version 2.x for your system.

Using QGIS

Once installed, you will find two different application shortcuts in your Windows/window manager’s menu: QGIS Desktop and QGIS Browser. QGIS Browser is a tool dedicated to making it easy to browse through your geospatial database holdings, be it an ESRI geodatabase or PostGIS. For each layer or data file, you can examine the metadata, preview the file, or examine the attributes stored in the data. The browser was introduced around the QGIS 1.8 time line and is similar to ArcCatalog for the ESRI users in the crowd. The main use for it is to quickly browse and examine your data without having to load it into QGIS proper.

QGIS_Browser

QGIS Browser

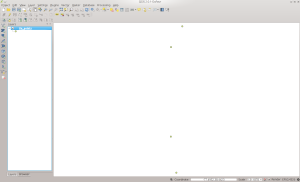
QGIS Desktop is the traditional GIS application that allows you to perform processing on your data in addition to visualizing and examining metadata. The default layout of QGIS is show below.

QGIS Desktop

QGIS Desktop

The QGIS 2.x layout differs slightly from the version 1.x layout. By default, along the left side of the window you will find the toolbar containing the add layers buttons for various types of data sources.

QGIS Layers Toolbar

QGIS Layers Toolbar

Next to that you will find a tabbed box that displays either the layers window or the browser built-in to QGIS Desktop. The browser here allows you to quickly find data that you can then click and add as a layer into the desktop application.

QGIS Layers and Browser Window

QGIS Layers and Browser Window

Along the top of the window, you will find the application menus and toolbars for functions such as opening/saving files, zooming, measuring, and other functions. Depending on what plug-ins you have installed an activated, there could be additional menus and toolbars such as the GRASS layers and functions bar.

QGIS Toolbars and Menus

QGIS Toolbars and Menus

GIS Layers

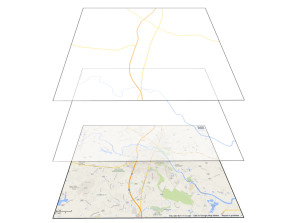
To use tools such as QGIS, you have to understand how such system work. GISs allow you to manipulate data based on the concept of a layer. Each layer represents a data set, be it raster (think aerial imagery) or vector (think points and lines that represent roads). At a minimum, these data sets are related to each other by their geographic area and temporal parameters. Inside the GIS, you can overlay the different data sets (layers) on top of each other. Usually, you will start with what is called a base map (think of the streets version of Google Maps) and then add more specific data sets on top of that. In the example below (which demonstrates my lack of artistic skills), you can see a Google Roads layer as the base map. Added to that is a river and then a road layer. Inside the GIS, all of these layers would overlay on to the base map so that everything lines up (assuming it has been georeferenced properly).

Layers Visualization

Layers Visualization

Loading Data into QGIS

Now we will use QGIS with a base map and overlay the points that you put into your own geospatial database from the last installment. If you did not put the Shapefile into the geodatabase, you can also simply add it as I will illustrate below.

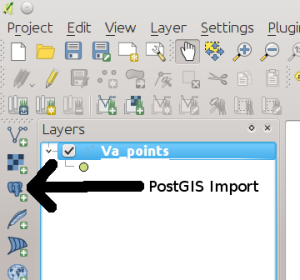
If you set up PostGIS and imported the file into it, start by clicking on the elephant-face icon as shown below.

PostGIS Import Button

PostGiS Import Button

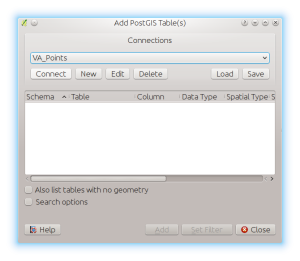
You will then be presented with the following dialog box.

Add PostGIS Table Dialog

Add PostGIS Table Dialog

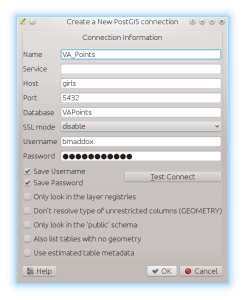
Click on the New button and fill out the information similar to the below figure but use your specific host, user, and database names.


PostGIS Connection Settings

PostGIS Connection Settings

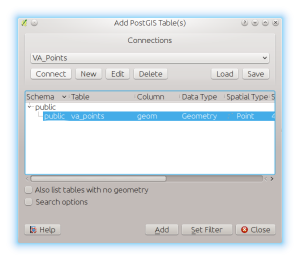
Click OK and then OK again if you chose to save your password like I did. Then, with the VA_Points layer selected in the drop-down, click the Connect button. You should then see an entry under Schema called public. Click on it and you will then see your table name similar to the below figure. Select the points layer and then click the Add button to add this layer to QGIS.

PostGIS Add Layer Dialog

PostGIS Add Layer Dialog

Your QGIS window should look similar to the below. If not, recheck your connection settings and try again.


QGIS Desktop

QGIS after adding the VA_Points layer

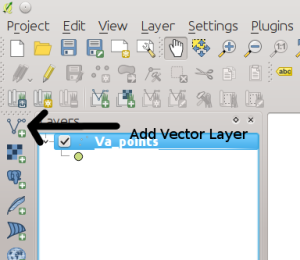
Note that if you just download the points layer, click on the Add Vector Layer button which looks similar to a V and is shown below.

QGIS Add Vector Layer Button

QGIS Add Vector Layer Button

Click the browse button and select the va_points.shp file from the zip archive you downloaded and then click OK. Your screen should look the same as the above.

 Adding a Base Map

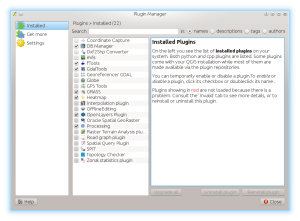
Now that we have the points layer added, it is time to add a base map so that you can see how the data overlays.  To do this, we will use the OpenLayers Plugin in QGIS to add a Google Maps satellite image.  First click on the Plugins menu item and select Manage and Install Plugins.  You will see a window similar to this one.

QGIS Plug-in Manager

QGIS Plug-in Manager

If you see the OpenLayers Plugin listed in the Installed plug-ins section, click the check box next to it to enable it.  If not, click on Get More tab and type OpenLayers in the Search box.  Click on OpenLayers and then click Install to put it on your system.

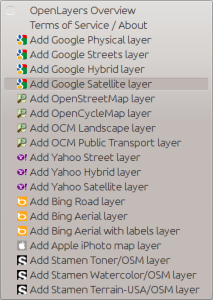
Now that OpenLayers is installed, click on Plugins again, click OpenLayers, and click Add Google Satellite Layer to add it to a new layer in QGIS.

OpenLayers Plug-in Menu

OpenLayers Plug-in Menu

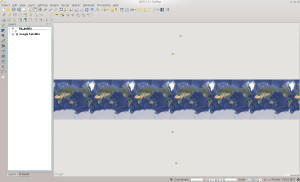
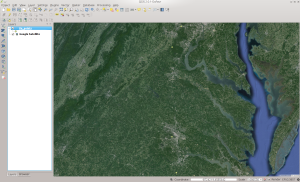
Once done, QGIS will look similar to below.  Do not panic, we will fix it shortly.

QGIS With Satellite Added

QGIS with the Satellite Layer Added

Geographic Extents

I specifically uses this sequence of steps in a work flow to demonstrate another GIS concept – the geographic extent.  Geospatial data has an extent an a time associate with them.  We first loaded the VA Points layer to set the geospatial extent to the area surrounding roughly the middle of Virginia.  The extent on the screen is then based on how much you zoom in or out of the image.  If you zoom in on a point, you are decreasing the geographic area (or extent) that is displayed on the screen.  If you zoom out, you then increase it.

If I had started with just the Google Satellite View, your extent would be as demonstrated in the image.  You then would have had to add the points and then zoom down to where the points are located.  However, as you can see from the above screen shot, when you add a layer using the OpenLayers plugin, it will default to a view such as above.  It appears to be zoomed way out and you see multiple side-by-side images of the Earth.  Plus, it is on top of your image.

Fixing OpenLayers Layers

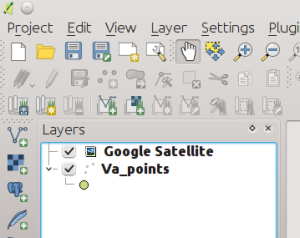
Fixing this is a very easy task.  First, on the layers side window, notice that the Google Satellite layer is on top of the VA_Points layer.

OpenLayers on Top

OpenLayers on Top of the Points

Click on the Google Satellite layer and drag it so that it is below the VA_points layer.  Your screen will then look like this.

Satellite Layer Below the Points

Satellite Layer Below the Points

Now click on the VA_points layer and select Zoom to Layer Extent.  This will redisplay all of the data so that it fits into the geographic area that the points layer covers.  As you can see below, this also sets the Google Satellite layer to the same extent as the points layer so that the points and satellite layer are both referenced together.

Satellite Layer with the Proper Extent

Satellite Layer with the Proper Extent

Changing the Points Color

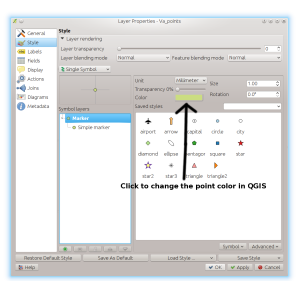
QGIS will select a random color for your points when you first add the layer.  As you can see from the above screen shot, it choose a green on my system which does not stand out that well over the satellite image.  You can double click on the green dot under the VA_points layer name to change the color.  Double-clicking brings up the properties for the vector layer.  The default should be to display the Style tab.

Vector Style Properties

Vector Style Properties

From here you can change various properties to alter how the layer appears on the screen.  You can select different symbol types, sizes, and other properties for each point.  We will just be changing the color for this example.  Click the color button to bring up the Select Color pop up.  I selected a bright red from the Forty Colors drop-down for the points in this example.

Color Button Location

Color Button Location

That’s it.  You now have successfully loaded two different data sets into QGIS.  As homework, find the zoom button in the top menu bar and zoom in to the areas around each point.  You will see that you get more detail from the Satellite layer as you decrease the geographic area around each point.  This is similar to how things would look if you were sitting on your roof looking at the ground versus looking at your house from the International Space Station.

Next Time

Since this post has already gotten very long, next time we will go through some of the other tools that exist inside QGIS, such as viewing metadata for a point and making measurements.

Posted in GIS