Using Free Geospatial Tools and Data Part 4: Tools of the Trade

Today there are a huge amount of Open Source geospatial tools out there. The Open Source GIS movement started with libraries to access data formats and has led to full blown geospatial systems today. We’ll look at a few of these that will prove useful to you while you’re working with data. Note that I’m not trying to give an exhaustive explanation how to use the tools here. The projects have already written up a lot of information about how to use them so I’m going to be lazy and not replicate it here. This post will at least give an idea of some of the big players in Open Source GIS so you can continue your investigations there.

Tools

The first project of interest is the Geospatial Data Abstraction Library (GDAL). For developers, GDAL provides a single interface to accessing various raster file formats. For users, it comes with a number of command line utilities that can perform functions from reprojecting data to converting files between various GIS formats. GDAL is used by several other Open Source projects as well for their file format access. We’ll look at some specific uses of GDAL later on. To learn more, visit their website at http://www.gdal.org/.

GDAL comes with several utilities that you might find useful in your geospatial explorations. gdalinfo will give you information about raster GIS files. ogrinfo will provide information on vector file formats. gdaltranslate will convert files to various other formats. gdalwarp will let you convert files to another coordinate system or merge multiple files into a single raster data set.

When appropriate, GDAL provides a wrapper to other libraries to access file formats. libtiff and libgeotiff are used to access the GeoTIFF file format. GeoTIFFs are an extension to the TIFF standard that allows for spatial data to be included with the file. They are mainly used for raster data such as aerial photographs. However, extensions such as 16-bit GeoTIFFs are used to store elevation data where each pixel encodes a height value. LibKML is used to access KML files such as those used with Google Earth. Libpng, libjpeg, and Jasper are used for other formats, and so on.

These libraries also provide useful utilities. One example is listgeo that I used in the last post in this series. Another is tiffinfo that will print out information from standard TIFF tags in a file. tiffcp and geotiffcp will copy files while preserving TIFF and the extended GeoTIFF tags.

As far as full-featured GIS go, the grand-daddy of them all is the Geographic Resources Analysis Support System (GRASS) GIS. GRASS was originally developed from 1982 to 1995 by the US Army Construction Engineering Research Laboratories that is a part of the US Corps of Engineers. For a while it retained its “old school GIS” roots (like early ESRI products) by having everything broken out into programs run from the command line. The Corps ceased developing GRASS around 1995 and it was then taken over by a group of people at Baylor University. It now has gone from simple graphics and requiring a lot of command line experience to a modern GUI thanks to an international group of developers. Of all the Open Source GIS tools, it is the closest competitor to a full featured GIS such as ESRI’s ArcGIS or ERDAS Imagine.


GRASS GIS Screenshot

Example of the Modern GRASS GIS GUI

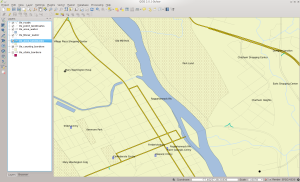
Another powerful Open Source GIS tool is the Quantum GIS (QGIS) project. QGIS started life around 2002 and became a part of the Open Source Geospatial Foundation. It was written using the Qt widget set and features a plugin architecture that allows users to contribute more features using Python or C++. It uses libraries such as GDAL to access numerous raster and vector formats and even includes a plugin so it can act as a front-end to GRASS. Additionally, it can consume OGC web services and interact with Oracle, PostGIS, and ESRI geodatabases. QGIS also features a world-wide group of developers and just recently hit the 2.0 release. For those familiar with ESRI products, it fits in a nebulous area between the old ArcView product and ArcMap. In some ways this author believes it outperforms either product thanks to the plugin architecture and its support of web services. In others it lacks many of the geoprocessing features of the ESRI products. However, it is easily powerful enough for most users who need to work with geospatial data.


QGIS Screenshot

QGIS 2.0 Running on Fedora 19

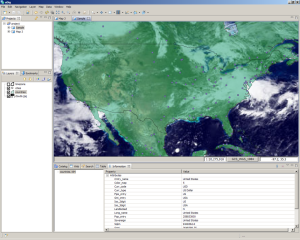
uDig is the third GIS tool in the lineup. It was created by the Canadian company Refractions Research and is based on the Eclipse framework. uDig also features a plugin architecture and can use GRASS for vector processing. Like the others, uDig can ingest OGC web services. Unlike the others, uDig is also used as a base for other GIS applications such as JGrass and Arbonaut. While not necessarily as full featured as QGIS or GRASS, uDig still has its place among the tools.


uDIG Screenshot

uDIG screenshot Courtesy Wikipedia

The System for Automated Geospatial Analyses (SAGA) GIS is an Open Source GIS originally developed by the Department of Physical Geography at the University of Gottingen in Germany and now by a group of international volunteers. SAGA also uses GDAL to read a large number of geospatial file formats. It focuses on geoscientific processing and can be called from the R statistical data analysis system. SAGA is similar to QGIS but includes some features not found in that package such as image pattern recognition and more geostatistical functionality. It is still under active development but has not had a new stable release since 2011.


SAGA GIS Screenshot

SAGA GIS Screenshot Courtesy Wikipedia

Databases

For storing geospatial data we have two main contenders. Spatial Databases are extensions to traditional relational database systems that allow you to do queries such as “give me all the points within five miles of this location.” The first, PostGIS, is a set of extensions to the PostgreSQL database also developed by Refractions Research and released to the world in 2001. PostGIS is probably the most popular Open Source geospatial database in the world, thanks to its functionality and full implementation of many OGC standards. It started as storing only vector data but was expanded to include raster in version 2.0. It includes geodatabase and geoprocessing functionality not even found in the commercial database offerings. Today it is used by many projects and has support by both proprietary and Open Source GIS tools. Tools such as QGIS can directly communicate with PostGIS to read and write data.

MySQL also has a set of spatial extensions and is catching up to PostGIS in functionality, although it still lags in some areas such as geography and 3D types, SRID projections, and directly querying by a radius. It is not as fully and directly supported by other Open Source GIS tools. However, it is faster for many operations than PostGIS due to the differences in architecture between the two. MySQL Spatial uses a polygon-based model where functions are implemented by bounding polygons.

This is just a brief introduction to Open Source GIS tools out there. I’d highly suggest poking around with your favorite search engine to learn more about what’s available. If you’re an experienced GIS professional, you could get up to speed with QGIS or GRASS fairly quickly. Next time, we’ll start looking at data and how to process it for your needs, including creating spatial databases.


Posted in GIS

Using Free Geospatial Tools and Data Part 3: Understanding Geospatial Data

Before going into what tools and data are available, I feel a quick introduction to geospatial data is in order. I’m going to gloss over some things and greatly oversimplify others. If you want to know more, I would suggest checking out books such as Map Projections: A Working Manual by Snyder or some excellent tutorials on map projections and GIS that can be found via your favorite web search engine.

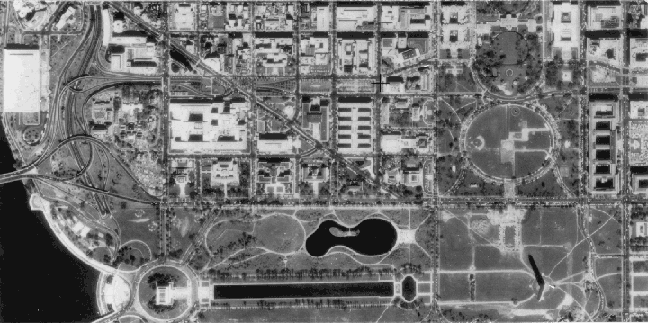
To begin, there are two main types of geospatial data available: raster and vector. Raster data are usually things such as aerial or satellite photographs, scanned paper maps, and so on. Vector data are mathematical vectors that describe items such as lines for roads, polygons for areas like parks, and others. As is, aerial photographs or vectors do not fully describe the Earth’s surface. They do not represent a one to one correlation between a point on the map and a location on the ground. They have to be run through a process called georectification to mathematically translate them to a coordinate system known as a map projection.

USGS DOQQ Of the Washington DC Area.

USGS DOQQ of the Washington DC Area Courtesy of Wikipedia

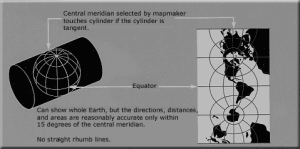
Map projections are mathematical descriptions of the surface of the Earth. As most of you (hopefully) know, the Earth is not flat. It’s a large spherical object with dents (canyons) and bumps (mountains). Since it’s not a flat sphere, it’s impossible to model it with 100 percent accuracy. Map projections were created that describe the Earth in terms of a series of equations that define a spheroid with various characteristics. These characteristics are useful for different types of representations, from maps of continents to maps of cities. I suggest you look at websites such as Map Projections: From Spherical Earth to Flat Map to get a more in-depth discussion. Basically, think of a map projection as establishing an average elevation of the Earth’s surface with areas where it’s more accurate than others.

USGS Traverse Mercator Projection.

USGS Traverse Mercator Projection. Courtesy Wikipedia

Georectification then takes the flat two-dimensional image or vector data and warps it so that it fits the three-dimensional surface of the Earth as approximated by the map projection. Once transformed, each pixel in a map image or each point on a vector matches its corresponding point on the Earth’s surface. Inside a GIS, you can then move the cursor around and see the matching latitude and longitude on the ground. If you wanted, you could take a GPS and even go there.

Axonometric Projection of a 3D object to a 2D surface.

Axonometric Projection of a 3D object to a 2D surface.  Courtesy Wikipedia

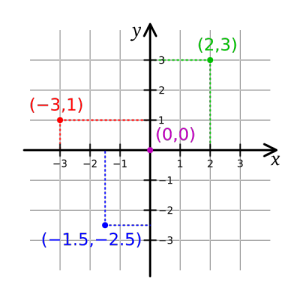
GIS file formats then allow the mathematical parameters that went into georectification to be encoded into the file as well. These are usually a large amount of numbers that describe the equations used and the inputs into all of those equations. Many times you’ll see something like below if you use a tool such as listgeo that can parse the information out of the file format. Note that most formats assume a Cartesian coordinate system running from coordinates (0,0) in the upper left corner to some X and Y to the size of the data set.

Cartesian Coordinate System

Cartesian Coordinate System Courtesy Wikipedia

listgeo o39102g6.tif
Geotiff_Information:
Version: 1
Key_Revision: 0.2
Tagged_Information:
ModelTiepointTag (2,3):
0 0 0 
691331.977 4417194.85 0 
ModelPixelScaleTag (1,3):
2.4384 2.4384 0 
End_Of_Tags.
Keyed_Information:
GTModelTypeGeoKey (Short,1): ModelTypeProjected
GTRasterTypeGeoKey (Short,1): RasterPixelIsArea
ProjectedCSTypeGeoKey (Short,1): PCS_NAD27_UTM_zone_13N
PCSCitationGeoKey (Ascii,25): "UTM Zone 13 N with NAD27"
End_Of_Keys.
End_Of_Geotiff.

PCS = 26713 (NAD27 / UTM zone 13N)
Projection = 16013 (UTM zone 13N)
Projection Method: CT_TransverseMercator
ProjNatOriginLatGeoKey: 0.000000 ( 0d 0' 0.00"N)
ProjNatOriginLongGeoKey: -105.000000 (105d 0' 0.00"W)
ProjScaleAtNatOriginGeoKey: 0.999600
ProjFalseEastingGeoKey: 500000.000000 m
ProjFalseNorthingGeoKey: 0.000000 m
GCS: 4267/NAD27
Datum: 6267/North American Datum 1927
Ellipsoid: 7008/Clarke 1866 (6378206.40,6356583.80)
Prime Meridian: 8901/Greenwich (0.000000/ 0d 0' 0.00"E)
Projection Linear Units: 9001/metre (1.000000m)

Corner Coordinates:
Upper Left ( 691331.977, 4417194.851) (102d45'44.74"W, 39d53' 6.48"N)
Lower Left ( 691331.977, 4400540.579) (102d46' 2.23"W, 39d44' 6.68"N)
Upper Right ( 704806.576, 4417194.851) (102d36'17.89"W, 39d52'55.15"N)
Lower Right ( 704806.576, 4400540.579) (102d36'36.61"W, 39d43'55.41"N)
Center ( 698069.276, 4408867.715) (102d41'10.37"W, 39d48'31.03"N)
Output of the listgeo command.

From the above output, we can see a few things that describe this image. It came from a USGS DRG that was mathematically warped to a projection (which is why some of them look “tilted” if you’ve looked at a lot of DRGs). Under the ModelTiepointTag key we see several zeros then the numbers 691331.977 and 4417194.85. If you look at the DRG as a two dimensional grid, those numbers represent the latitude and longitude (x, y) coordinates of the upper left pixel in the image. The projection of the DRGs uses meters so the x and y here represent meters in the coordinate system. Under the ModelPixelScaleTag we see another set of numbers, including 2.4384 listed twice. This is the per-pixel scale of the image in meters. So this means that as you increase in the x- or y- direction of the image, each pixel you count up equals 2.4384 meters on the ground. Moving from pixel (0,0) to (10,10) in this case only moves you by a value of 10 on the grid, but would move you 24.384 meters on the ground.

Scale is another issue that may seem counter-intuitive to many people. There are two scales of data that you may hear about: large and small scale. Large scale actually means data that is more detailed than a small scale. The scales do not reference the size of the map but the scale of the map to the Earth. Obviously a 1:1 scale map of the Earth is not feasible since it would have to be as large as the planet. Maps are scaled down to make them much smaller. A common size of a large scale map is 1:25,000 and a small scale map is 1:100,000. The 1:25,000 map is called a large scale because it’s fractional size is larger than that of the 1:100,000 scale map (think of the scales as fractions). A 1:25,000 large scale map does not show as much surface area as the 1:100,000 small scale map, but it shows an area in much more detail than the small scale map does. Think of a large scale map as maps of things like cities, while small scale maps are more along the lines of maps of entire countries.

With the scale discussion out-of-the-way, we then must turn to the usability of geospatial data. Much digital map data was collected from paper maps. Thus, the digital data has a scale where it is most accurate and less accurate at others. Data collected at 1:25,000 scale will be more accurate than data collected at 1:100,000. A GIS allows you to zoom in to the data and in some cases over-zoom past the actual accuracy of the data. Consider data such as a USGS Digital Elevation Model that was collected on a ten meter grid. You can zoom to a view where each pixel on the screen is smaller than ten meters on the ground, but your measurements will not be any more accurate than the ten meter grid you are viewing. Another example is looking at two road maps where one was collected at 1:25,000 and the other at 1:250,000. If you overlay the road maps on to a georeferenced aerial photograph, the 1:25,000 lines will more closely follow actual roads than the ones from the 1:250,000. You cannot expect the 1:250,000 data to be as accurate as the larger scale data, so zooming into a data set will not make the 1:250,000 data any more accurate than the scale where it was captured.

With this out-of-the-way, next time we will start looking at Open Source tools to use the data.

Mono 3.2.3 and Fedora 19 and a KeePass fix

If anyone is interested in installing Mono 3.2.3 on Fedora 19, here is what I did.  Note that if something breaks and your favorite app quits working then it’s all on you 😉

I found that someone out there had built Mono 3.2.3 RPMS for Fedora and created a repository.  However, since I was unable to find a .repo file, I went ahead and created this one:

[mono_linet]
name=Mono 3 repository
baseurl=http://yum.linet.dk/opensource/fedora-19-x86_64/RPMS/
enable=1
gpgcheck=0

Once this is done, do a yum update and you should be good to go.

However, I noticed I could no longer run KeePass on my system.  I had followed the instructions found here and use KeePass on my computer, phone, and tablet.  With Mono 3.2.3 KeePass wouldn’t work.  Simple fix is to change to /usr/lib and run the following command:

sudo ln -s /usr/lib64/libgdiplus.so libgdiplus.so

This should make KeePass run again.  Note you’ll get some errors on close if you run it from a console.  These appear to be harmless.