In this part of the series, I want to go over image salience and how it can be applied to finding “interesting” things in LiDAR. Image salience (usually used to make salience maps) refers to the ability to identify and highlight the most important or attention-grabbing regions in an image. It is meant to highlight areas of an image where the human eye would focus first. Salience maps are used to visualize these regions by assigning a salience value to each pixel, indicating its likelihood of being a point of interest. This technique is widely used in computer vision for tasks such as object detection, image segmentation, and visual search.
Background Research
Salience research actually has been going on for decades now. It began back in the 1950’s where it was a field of psychology and neuroscience that sought to understand how humans perceive and prioritize visual information. It mainly stayed in the neuroscience and psychology fields until roughly the end of the 1970’s.
In the 1980’s David Marr proposed a computational theory of vision that provided a framework for understanding the stages of how visual systems could process complex scenes. This can be considered the beginning of trying to recreate how humans prioritized “interesting” parts of an image. This also can be considered the base upon which later computer science work would be performed.
In the 1990’s the concept of salience maps was proposed to model how the human visual system identifies areas of interest by Itti, Koch, and Neibur. In 1998 they created one of the first computational models that combined features such as color, intensity, and orientation to calculate areas of interest. These algorithms added more complex features during the 2000’s.
With the rise of deep learning in the 2010’s, image salience took a turn and began to use CNNs for detection. By definition, a CNN learns hierarchical features from large datasets and can identify complex patterns in images. Combined with techniques such as adversarial learning, multi-scale analysis, and attention mechanisms, salience map generation is now more accurate than it has ever been.
CNN Salience Methods
Let us briefly examine how CNNs / deep learning are used in modern times for salience detection:
- By definition, convolutional layers in a CNN extract local features from an input image. Early layers in the network capture low-level features such as edges and textures, while later levels in the network capture higher-level features such as actual objects. Multi-scale analysis to process features at different resolutions can also help with salience detection with a CNN.
- Pooling layers reduce the spatial dimensions of the feature maps. This makes the computation more efficient and can even provide a form of spatial invariance so that features do not need to be the exact same scale.
- The final fully-connected layer can then predict the salience map of the image based on the information gathered through the various layers.
- An encoder-decoder architecture can be used as another extraction mechanism. Encoders extract features from the image using convolutional layers while gradually reducing the spatial dimensions of the image so that it can increase the depth of the feature maps.
- Decoders can then reconstruct the salience map from the encoded features. In this case they may use techniques such as transposed convolutions to upscale the image or “unpooling” to restore the image to the original size.
- Feature pyramid networks can process an image at multiple scales to gather coarse and fine details and then integrate the information into a final salience map.
- Finally, generative adversarial networks can be used to produce salience maps by using a generator to create a map and a discriminator to evaluate the quality of the map. The generator learns to produce more accurate maps over time by attempting to “fool” the discriminator.
Salience Maps
So what is a salience map? A salience map is a representation that highlights the most important or attention-grabbing regions in an image. It assigns a salience value to each pixel, indicating its likelihood of being a region of interest. They are the end result of running a salience detector and can be used for:
- Object detection by finding and localizing objects in an image.
- Image segmentation by dividing the image into segments or objects based on their salience.
- Visual search which can be used for things like scene understanding and image retrieval by identifying which areas should have more processing performed.
- Attention prediction can be used to highlight areas where a person would be most likely to focus their attention.
Why Image Salience?
The last use is what this post is about: automatically finding areas in LiDAR that need to be inspected or to find anomalies in LiDAR. Imagine you are a large satellite company that collects thousands of images a day. It would be time consuming for a human to scan all over each image for something of interest. Salience maps are useful here in that they can help guide a human to places they need to examine. Potentially, this could be a huge time saver for things like image triage.
LiDAR in raster format provides some challenges, though, for image salience. For one, LiDAR represents dense, three-dimensional data instead of a normal two-dimensional image. It requires pre-processing, such as noise reduction and normalization. LiDAR can contain varying point densities and occlusions in the point cloud. This makes LiDAR harder to analyze as we are dealing with a “different” type of image than normal.
Conversion of point data to raster can also make things problematic for salience detection. LiDAR has several classes, one such class being bare earth. In most cases, rasterization processes will convert the points to heights based on ground level. However, in cases of buildings, this would typically have void areas because the laser cannot penetrate a building to find the ground level. Most tools will fill these voids with a flat ground-level elevation as many people do not wish to see empty areas in their data. This can make structures on bare earth rasters look similar to things like roads, thus an algorithm might have trouble differentiating the two.
Image Salience and LiDAR Workflow
Since I did not really cover this in the last post, here I will outline a workflow where salience and/or segmentation can be used to help with the processing of large LiDAR datasets (or really any type of raster dataset).
- Once the point data has been converted to a raster, salience maps can be generated to identify and extract areas in the imagery that appear to contain meaningful features.
- A human can either manually examine the identified areas, or some other complex object detection analysis algorithm can be run against the areas. This is where the time saving comes into play as only specific parts of the image are examined, not the entire image itself.
- Features that are recognized can then be used for higher level tasks, ranging from identifying geographic features to detecting buildings.
Enough talk and history and theory, let us see how these algorithms actually work. This source can be found at on github under the salience directory. This time I made a few changes. I added a config.py to specify some values for the program to avoid having a lot of command line arguments. I also have copied the ObjectnessTrainedModel from OpenCV into the salience directory for convenience as not all packaging on Linux actually has the model included.
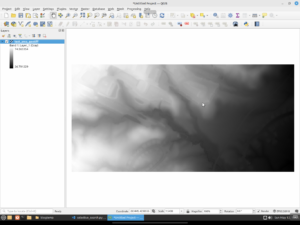
As a reminder, here are the input data sets from the last post (LiDAR and Hill Shade):
First off we will look at the algorithms in the venerable OpenCV package. OpenCV contains four algorithms for computing salience maps in an image:
- Static Saliency Spectral Residual (SFT). This algorithm works by using the spectral residual of an image’s Fourier transform to generate maps. It converts the image to the frequency domain by applying the Fourier transform. It then computes the spectral residual by removing the logarithm of the frequency amplitude spectrum’s average from the logarithm of the amplitude spectrum. It then performs an inverse Fourier transform to convert the image back into the spatial domain to generate the initial salience map and applies Gaussian filtering to smooth out the maps.
- Static Saliency Fine Grained (BMS). This algorithm uses Boolean maps to simulate how the brain processes an image. First it performs color quantization on the image to reduce the number of colors so that it can produce larger distinct regions. It then generates the Boolean maps by thresholding the quantized image at different levels. Finally, it generates the salience map by combining the various Boolean maps. Areas that are common across multiple maps are considered to be the salient area of the image.
- Motion Salience (ByBinWang). This is a motion-based algorithm that is used to detect salient areas in a video. First it calculates the optical flow between consecutive frames to capture the motion information. It then calculates the magnitude of the motion vectors to find areas with significant movement. Finally, it generates a salience map by assuming the areas with higher motion magnitudes are the salient parts of the video.
- BING Saliencey Detector (BING). This salience detector focuses on predicting the “objectness of image windows, essentially estimating how likely it is that a given window contains an object of interest. It works by learning objectness from a large set of training images using a simple yet effective feature called “Binarized Normed Gradients” (BING).
For our purposes, we will omit the Motion Salience (ByBinWang) method. It is geared towards videos or image sequences as it calculates motion vectors.
As this post is already getting long, we will also only look at the OpenCV image processing based methods here. The next post will take a look at using some of the more modern methods that use deep learning.
Static Saliency Methods
The static salience methods (SFT and BMS) do not produce output bounding boxes around features of an image. Instead, they produce a floating point image that highlights the important areas of an image. If you use these, you would normally do something like threshold the images into a binary map so you could find contours, then generate bounding boxes, and so on.
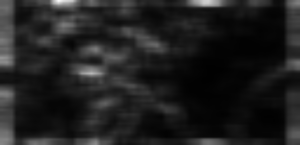
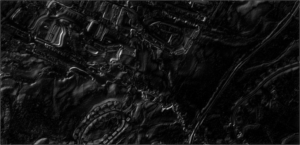
First up is the SFT method. We will run it now on the LiDAR GeoTIFF.
As you can see, when compared to the above original, SFT considers a good part of the image to be unimportant. There are some areas highlighted, but they do not seem to match up with the features we would be interested in examining. Next let us try the hill shade TIFF.
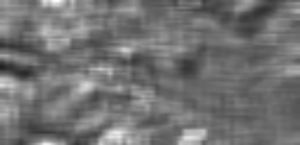
For the hill shade, SFT is a bit all over the place. It picks up a lot of areas that it thinks should be interesting, but again they do not really match up to the places we would be interested in (house outlines, waterways, etc).
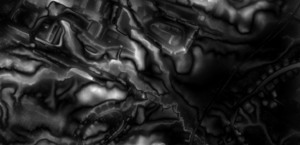
Next we try out the BMS method on the LiDAR GeoTIFF.
You can see that BMS actually did a decent job with the LiDAR image. Several of the building footprints have edges that are lighter colored and would show up when thresholded / contoured. The streams are also highlighted in the image. The roadway and edges at the lower right side of the image are even picked up a bit.
And now BMS run against the hill shade.
The BMS run against the hill shade TIFF is comparable to the run against the LiDAR GeoTIFF. Edges of the things we would normally be interested in are highlighted in the image. It does produce smaller highlighted areas on the hill shade versus the original LiDAR.
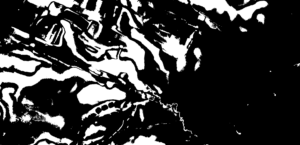
The obvious downside to these two techniques is that further processing has to be run to produce actual regions of interest. You would have to threshold the image into a binary image so you could generate contours. Then you could convert those contours into bounding boxes via other methods.
Object Saliency Method
BING is an actual object detector that uses a trained model to find objects in an image. While not as advanced as many of the modern methods, it does come from 2014 and can be considered the more advanced detection method available for images in OpenCV. In the config.py file, you can see that with BING, you also have to specify the path to the model that it uses for detection.
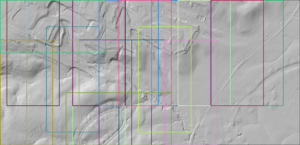
Here we see that BING found larger areas of interest than the static salience methods (SFT and BMS). While the static methods, especially BMS, did a decent job at detecting individual objects, BING generates larger areas that should be examined. Finally, let us run BING against the hill shade image.
Again we see that BING detected larger areas than the static methods. The areas are in fact close to what BING found against the LiDAR GeoTIFF.
Results
What can we conclude from all of this? First off, as usual, LiDAR is hard. Image processing methods to determine image salience can struggle with LiDAR as many areas of interest are not clearly delineated against the background like they would be in an image of your favorite pet. LiDAR converted to imagery can be chaotic and really pushes traditional image processing methods to the extremes.
Of all of the OpenCV methods to determine salience, I would argue that BMS is the most interesting and does a good job even on the original LiDAR vs the hill shade TIFF. If we go ahead and threshold the BMS LiDAR image, we can see that it does a good job of guiding us to areas we would find interesting in the LiDAR data.
The BING objectness model fares the worst against the test image. The areas it identifies are large parts of the image. If it were a bigger piece of data, it would basically say the entire image is of interest and not do a great job helping to narrow down where exactly a human would need to look. And in a way this is to be expected. Finding objects in LiDAR imagery is a difficult task considering how different the imagery is versus normal photographs that most models are trained on. LiDAR does not often provide an easy separation of foreground versus background. High-resolution data makes this even worse as things like a river bank can have many different elevation levels.
Next time we will look at modern deep learning-based methods. How will they fare? Will they be similar to the BING objectness model and just tell us to examine large swaths of the image? Or will they work similarly to BMS and guide us to more individual areas. We will find out next time.

